
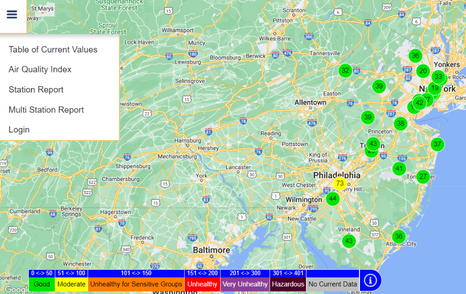
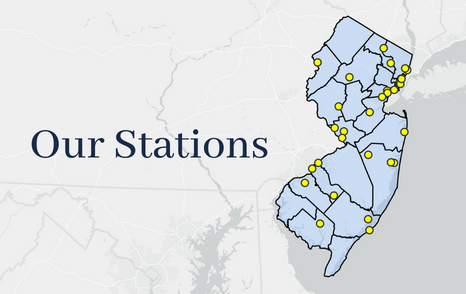
New Jersey operates 29 air monitoring stations throughout the state, keeping track of the quality of our air.
This is part of DEP’s commitment to revitalize our communities and protect human health.
New Jersey operates 29 air monitoring stations throughout the state, keeping track of the quality of our air.
This is part of DEP’s commitment to revitalize our communities and protect human health.
AirNow Forecast
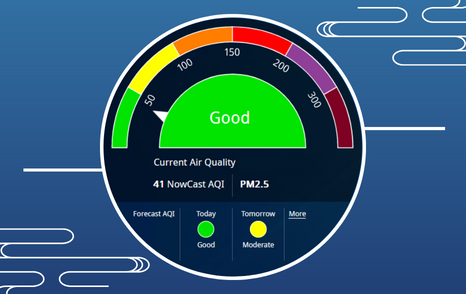
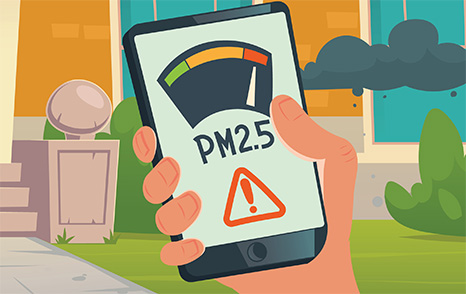
View the daily air quality forecast for NJ and the current Air Quality Index ratings for ozone & particulate matter.
Air Quality Forecast
Sign up for emails or get the app to receive daily local air quality forecasts and alerts.
NJ Air Quality
Check out your local air quality data.
Announcements
The 2025 Network Plan draft is now available.
May 20, 2025
Read our latest Network Plan for 2025. This plan is open for public review and comments until June 20, 2025.
Trenton Community Air Project
March 24, 2025
Check out our latest air quality community project using low-cost air sensors. This project was conducted in Trenton using PurpleAir sensors from 2022-2024 in partnership with NJDEP, Delaware Valley Regional Planning Commission (DVRPC), and the City of Trenton. Here you can find the results of this study that were presented to DVRPC at their most recent monthly meeting.
The 2023 Annual Report is now available.
January 2, 2025
Read our latest report on air quality in New Jersey.
PurpleAir SD card data processing available now!
August 8, 2024
This R Shiny app merges PurpleAir SD card data into one file in a .csv format for comparison to other PM2.5 instruments.
What, How, & Where DEP Monitors
Pollutants Monitored
Learn more about the six criteria pollutants and the air toxics that are measured by the Bureau of Air Monitoring.
How We Monitor
A variety of instruments and methods are used by DEP to measure concentrations of pollutants in the outdoor air.
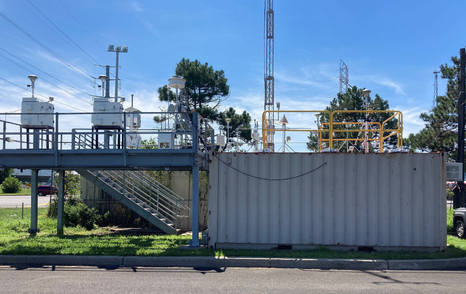
Air Monitoring Stations
DEP currently operates 29 air monitoring stations located throughout New Jersey. See where they’re located and what pollutants are measured.
Community Science
Communities can now also monitor their own air quality.
Air Quality Trends
New Jersey has been monitoring air quality since 1965. Pollution levels have improved significantly over the decades as a result of state, regional and national air pollution reduction efforts. The graphs available below illustrate more recent trends in pollutant concentrations.


Download Air Quality Data
DEP reviews and edits the air monitoring data it collects, and at the end of each calendar quarter, submits that data to the U.S. Environmental Protection Agency’s Air Quality System (AQS) database. The data available on our DEP website has not yet been reviewed.