
NJ Integrated Water Quality Assessment Report 2022 – Statewide Water Quality
Clean Water Act 303(d) List & 305(b) Report

Aquatic Life General

Aquatic Life Trout

Primary Recreation

Secondary Recreation

Water Supply

Shellfish

Fish Consumption
The DEP determines water quality in the State by verifying if waterbodies are supporting their designated uses. This is achieved by evaluating the water quality parameters associated with each designated use and whether they meet their surface water quality standards (SWQS). The SWQS identify specific designated uses for the waters of the State according to their waterbody classifications. Designated uses include:
| Designated Use | Description | Number of AUs |
Parameters Result Tables for Designated Use |
|---|---|---|---|
| Aquatic Life General | Can these waters support a healthy ecosystem? | 958 | General Aquatic Life Result Table |
| Aquatic Life Trout | Can species of trout survive or reproduce in these waters? | 200 | Trout Aquatic Life Result Table |
| Water Supply | Can we use these waters as sources for drinking water? | 825 | Water Supply Result Table |
| Recreation Primary | Can we swim, water ski, surf or do other submergible activities in these waters? | 936 | Primary Recreation Result Table |
| Recreation Secondary | Can we boat, wade, or jetski in these waters? | 32 | Secondary Recreation Result Table |
| Fish Consumption | Can we eat fish from these waters? | 958 | Fish Consumption Result Table |
| Shellfish Harvest | Can we eat clams, oysters or mussels from these waters? | 174 | Shellfish Harvest Result Table |
There are a total of 958 AUs in the State
Designated Use Results Statewide
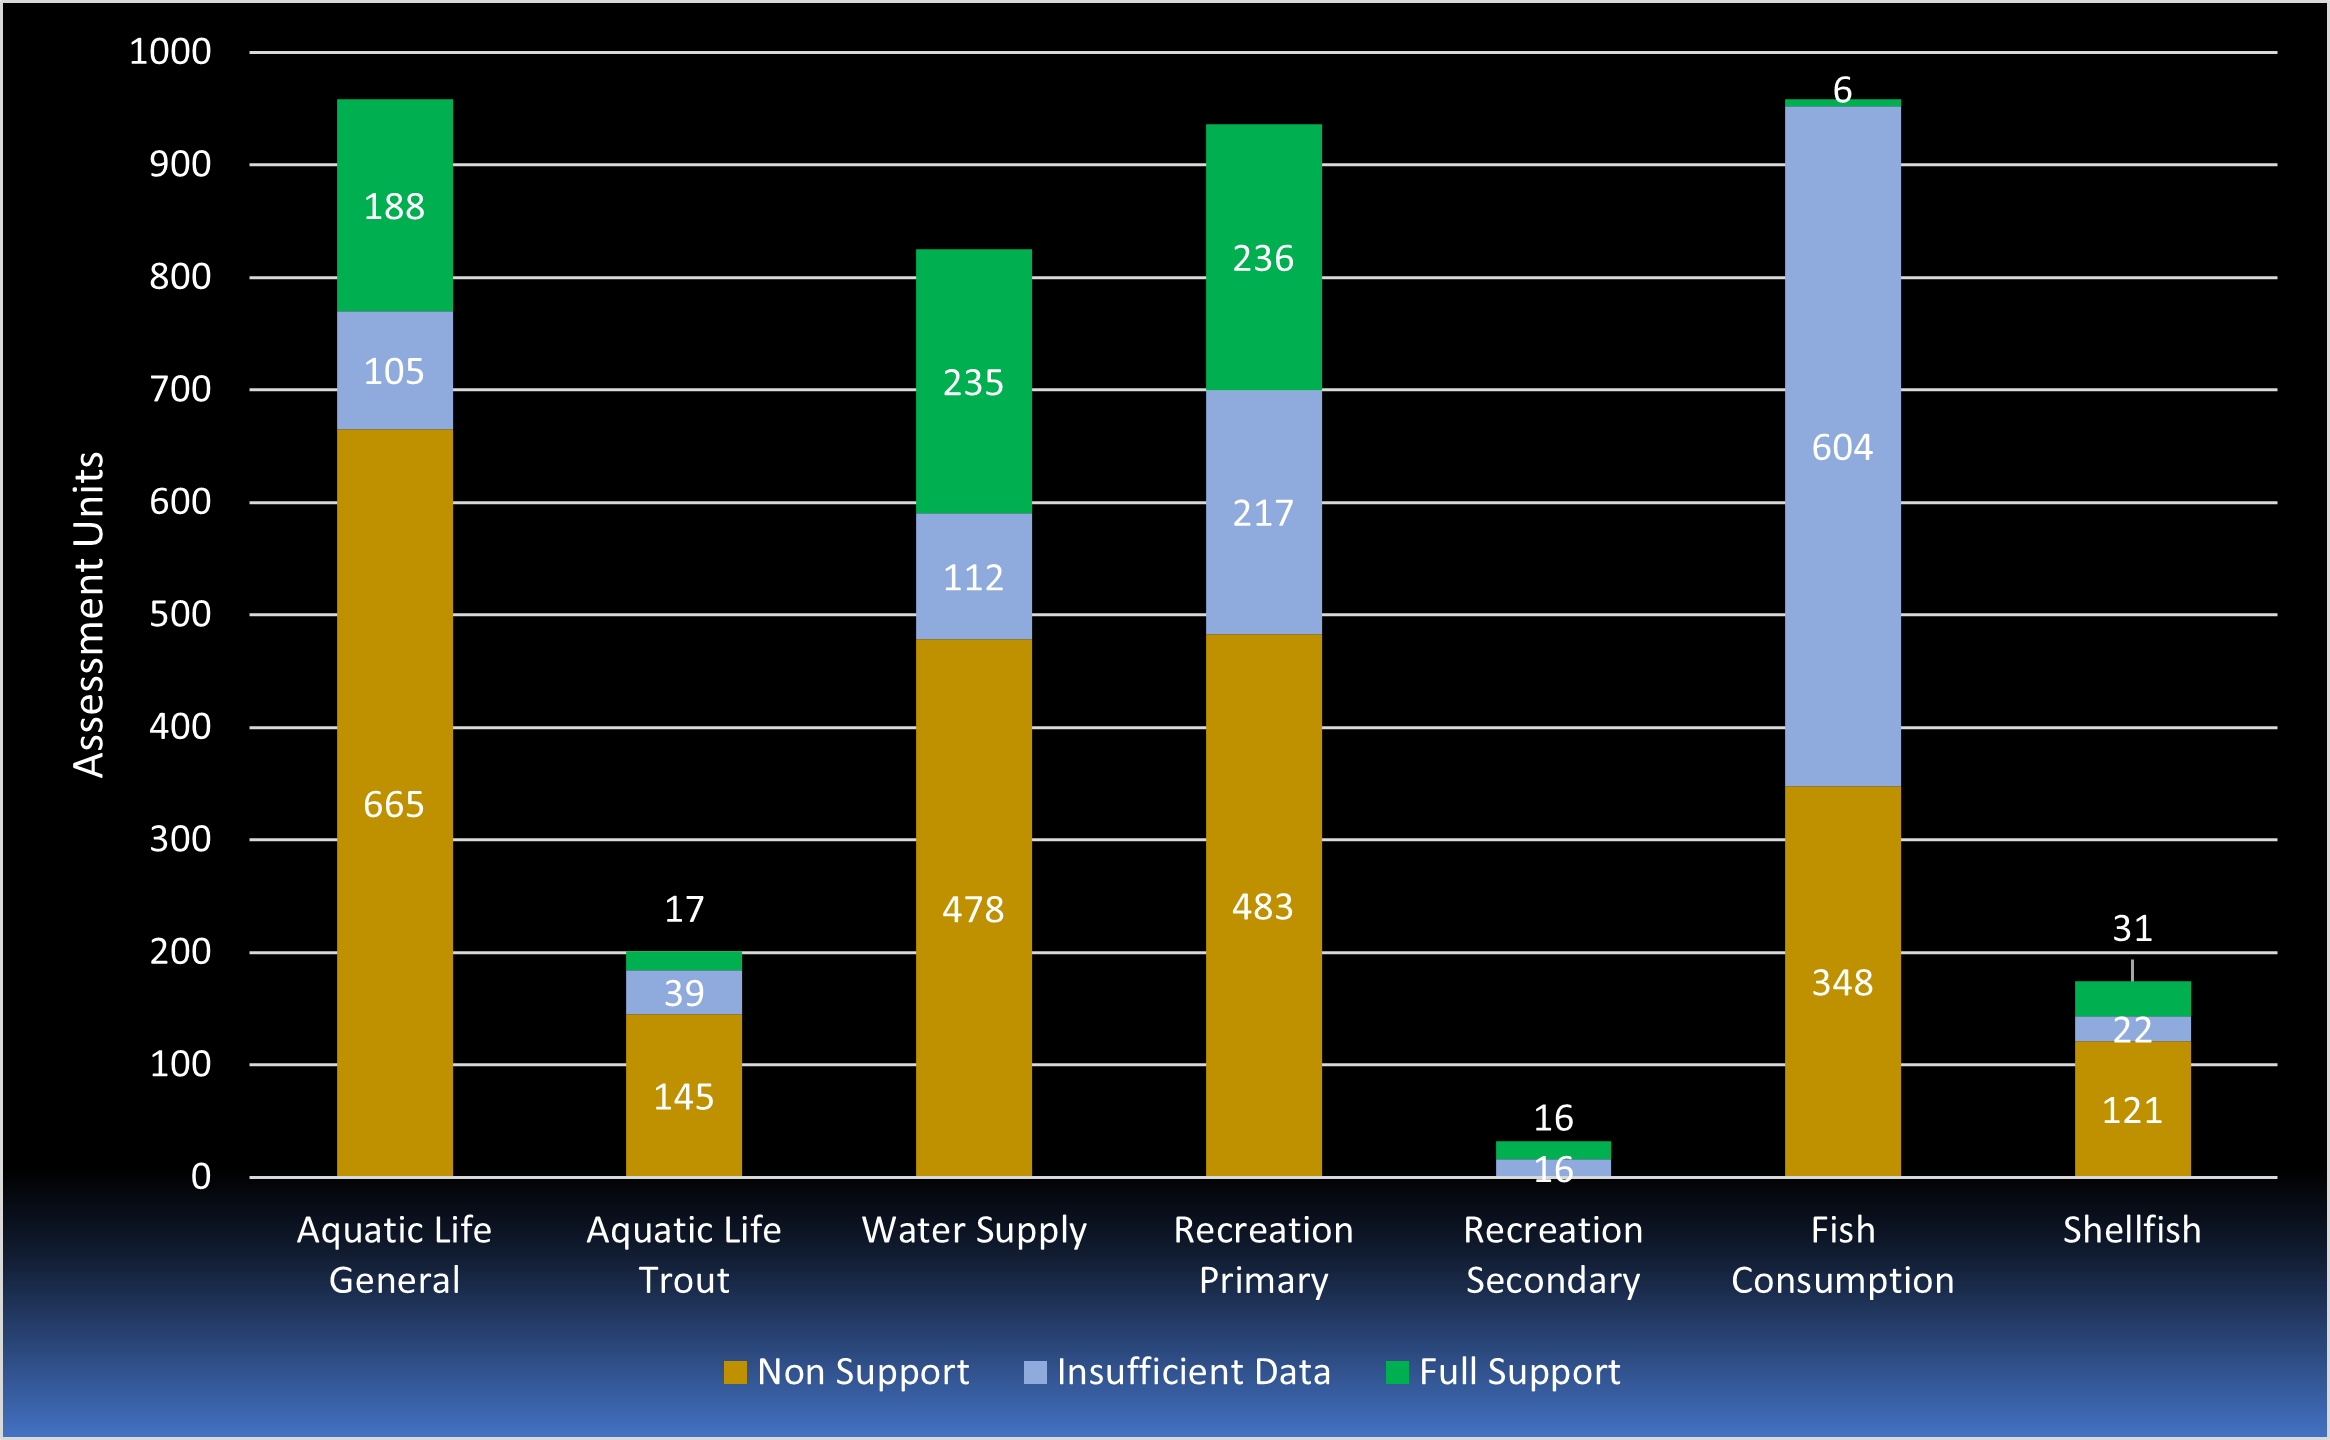
| Assessment | Aquatic Life General | Aquatic Life Trout | Water Supply | Recreation Primary | Recreation Secondary | Fish Consumption | Shellfish |
|---|---|---|---|---|---|---|---|
| Full Support | 20% | 9% | 28% | 25% | 50% | 1% | 18% |
| Insufficient Data | 11% | 19% | 14% | 23% | 50% | 63% | 13% |
| Non Support | 69% | 72% | 58% | 52% | 0% | 36% | 70% |
The waters of New Jersey are stressed. Stressed conditions are a result of multiple factors. First, New Jersey uses a conservative assessment method that ensures accurate and confident decisions in identifying water quality issues and health. An impairment for a designated use may be tied to one parameter exceeding criteria at one of many monitoring sites. Second, as the most densely populated state in the country, numerous pollutants from point and nonpoint sources are impacting water quality. Decades of industrial growth and urbanization, loss of important wetlands, fragmentation of forested areas, direct discharges to waterbodies, aging infrastructure, increases in storm runoff, damming of rivers and streams, climate change and numerous other anthropogenic activities have caused water quality degradation throughout the state. Third, historical practices before environmental regulations such as untreated discharges, indiscriminate dumping and abandonment of industrial sites have left behind a legacy of contaminated sites that still impact our waterbodies.
In response to these stressors to water quality, the DEP for over 50 years has implemented numerous programs to protect, maintain and restore waters of the State. These programs implement regulatory and non-regulatory actions that are described in more detail under the “Restoration and Protection Efforts” and “Water Pollution Control Programs” tabs in this report.
The designated use results reflect an increase in the number of impaired waters in New Jersey compared to previous reporting cycles. However, this does not necessarily indicate worsening water quality conditions. In each listing cycle, there are changes that affect the assessment universe and protocols for assessment decisions.
- Improved detection limits for measuring pollutants,
- Improved sampling techniques,
- Improved equipment technology,
- More rigorous assessment procedures, water quality standards, and waterbody classifications
- Most importantly, sampling in waters that were previously unassessed has resulted in an increase in the number of impaired waters.
Go to the link below to view the results as an interactive map. There are interactive maps for each designated use that present the designated use results along with each associated parameter result at the AU level and the stations within the AUs. Search for your results by your current location, address, municipality, or AU name.
Changes to Designated Uses Statewide (2020 to 2022)
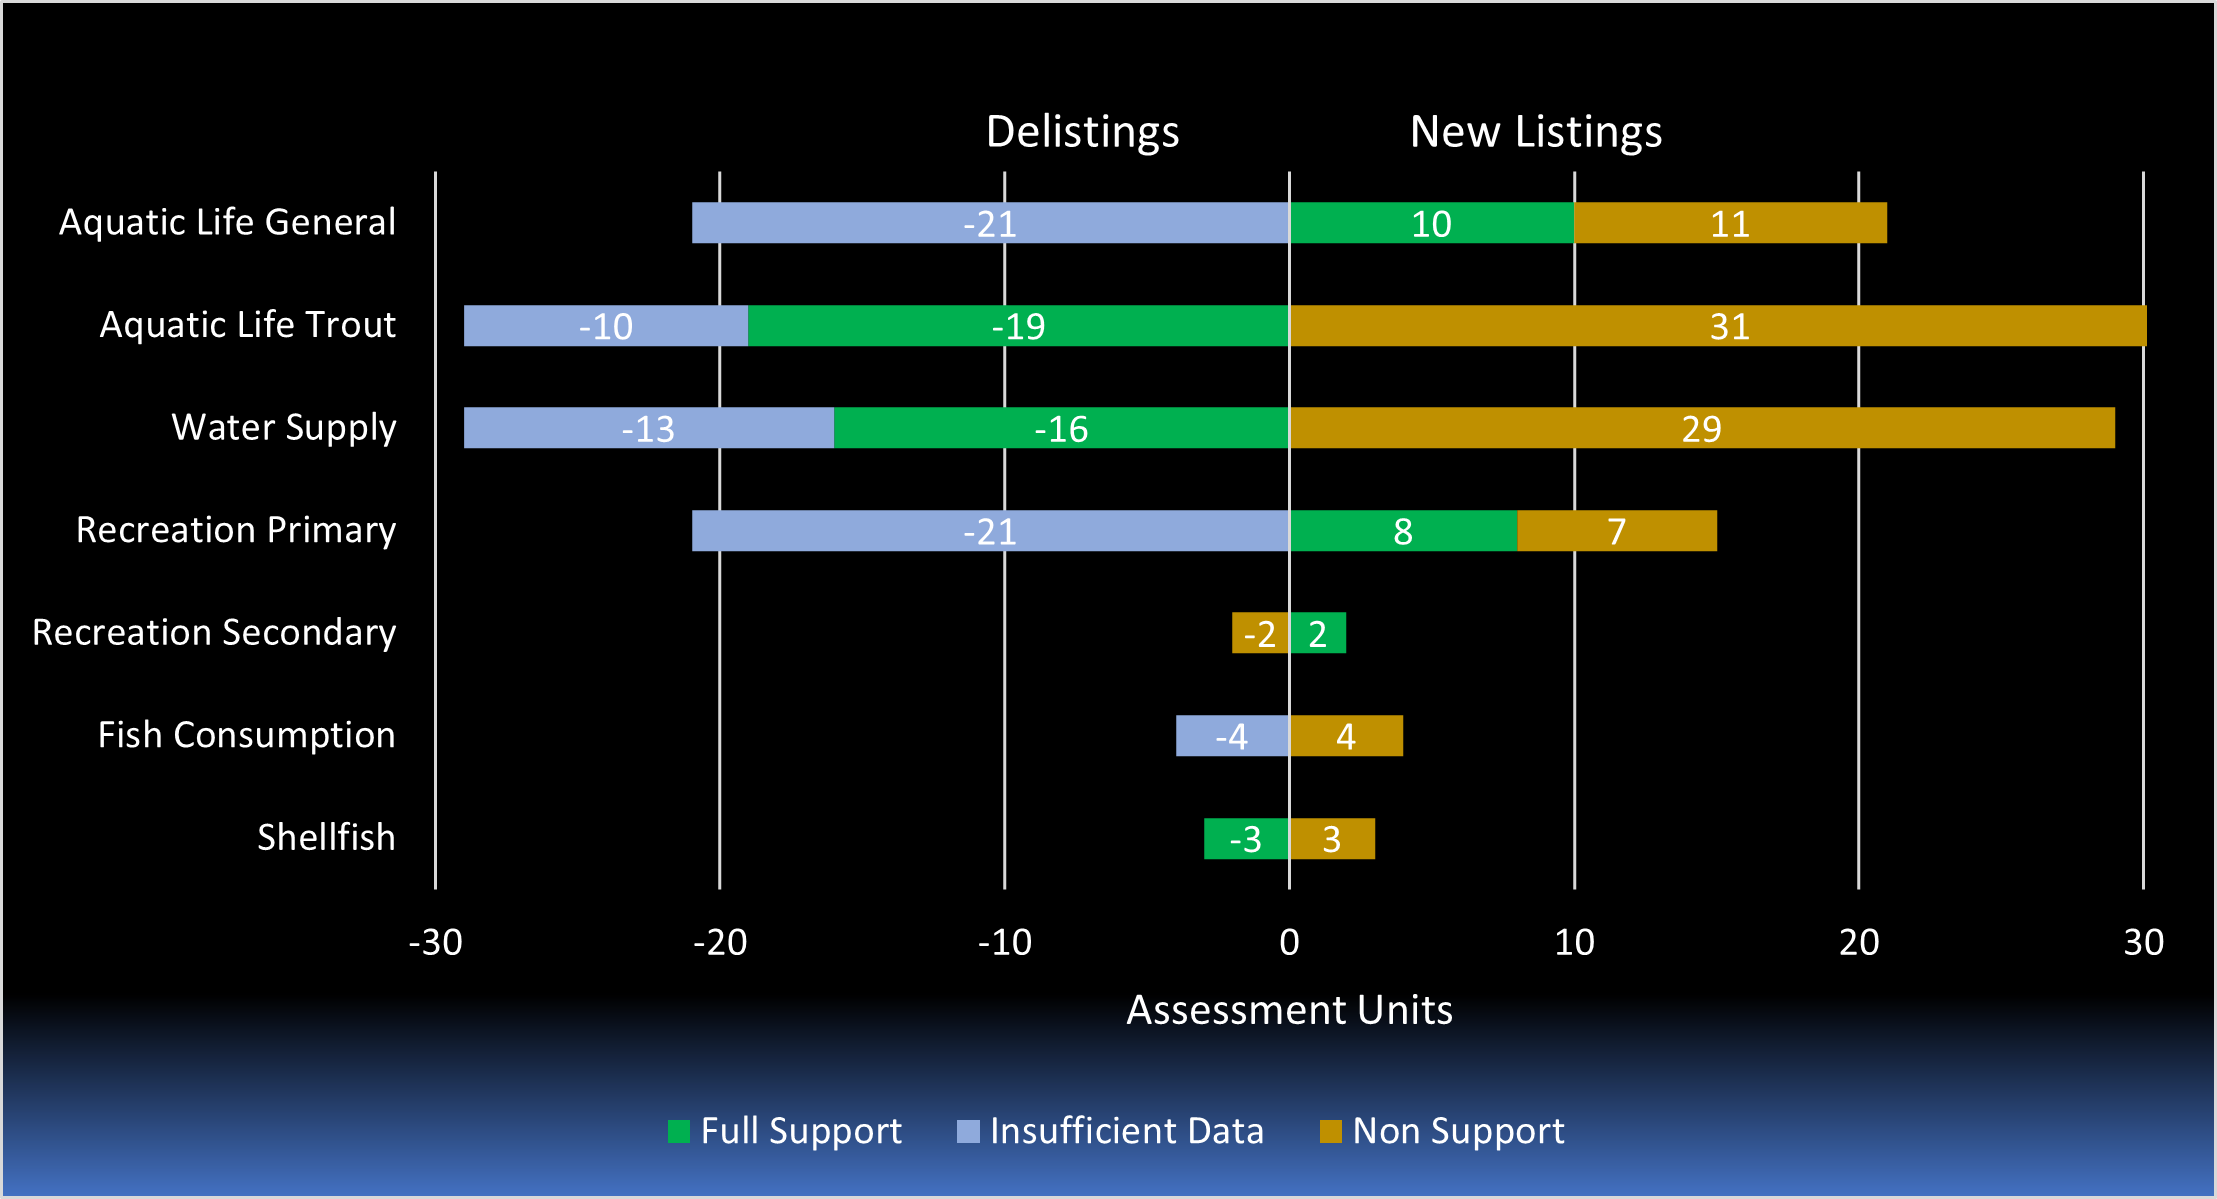
The chart above shows the delistings and new listings for each designated use. For example between 2020 and 2022, Aquatic Life General had 21 less “Insufficient Data” AU listings and an additional 10 “Full Support” AU listings and an additional 11 “Non Support” AU listings. The number of delistings and new listings usually are the same amount except for Aquatic Life Trout that had 29 delistings and 31 new listings and Recreation Primary that had 21 delistings and 15 new listings. What is not showing in the chart is that for Aquatic Life Trout two AUs changed from “Not Applicable” to “Insufficient Data” because there were trout waters in the AUs. For Recreation Primary, six “Insufficient Data” listings changed to “Not Applicable” since these AUs had only Recreation Secondary uses.
New water quality monitoring notably reduced the number of AUs with insufficient data with the predominance of the changes occurring in the focus region in the Northeast. Most of the new changes to designated uses confirmed impaired conditions. Recreation use was the only designated use that showed a slight improvement.
Water supply use revealed a significant shift from fully supporting to impaired conditions as a direct result of more intense arsenic sampling. Arsenic is the predominant cause of water supply use impairment with 97% of the impaired AUs affected by arsenic. The frequency of arsenic impairment has increased over time due to improved laboratory detection of arsenic at levels approaching the SWQS human health criterion for arsenic of 0.017 micrograms per liter (ug/L) and a drastic increase in sampling. The human health criterion is much more stringent (by more than an order of magnitude) than the New Jersey maximum contaminant level (MCL) of 5 ug/L established in the Safe Drinking Water Act rules at N.J.A.C. 7:10-5.2.
What is the difference between the MCL and SWQS?
Although the same health risk factors are used to develop the MCL and SWQS human health criteria, the Safe Drinking Water Act takes into consideration additional factors such as the feasibility of treatment, cost, and analytical capabilities to set the MCLs for all treatment facilities. Surface water quality criteria are based solely on data and scientific research on pollutants and their environmental and human health effects, SWQS do not consider economic or social impacts. The SWQS criteria is based on a risk level of one-in-one-million and expressed as a 70-year exposure average.As a result, 464 AUs are not supporting based on the SWQS human health criteria, but only a few waterbodies have any incidences of arsenic concentrations above the drinking water MCL.
Associated Parameters for Each Designated Use*
| Designated Use | Required Parameters | Other Parameters |
|---|---|---|
| Aquatic Life General | Biological Data | DO, TP, Temperature, pH, TSS, Turbidity, Ammonia, Chloride, Metals, Chlorpyrifos, Malathion |
| Aquatic Life Trout | Biological Data and Temperature and DO | TP, pH, TSS, Turbidity, Chloride, Metals, Chlorpyrifos, Malathion |
| Water Supply | Nitrate | TDS, Sulfate, Chloride, Metals, Toxin Substances |
| Primary Recreation | E. coli or Enterococcus | |
| Secondary Recreation | Fecal Coliform | |
| Shellfish Harvest | Fecal Coliform | |
| Fish Consumption | Fish Tissue (at least one) | Metals, Toxin Substances |
Biological Data – Approved NJDEP biological index (benthic macroinvertebrate, fish, headwaters)
Metals – Arsenic, Cadmium, Chromium, Copper, Lead, Mercury, Nickel, Selenium, Silver, Thallium, Zinc
Toxin Substances – Benzo(a)pyrene, Hexachlorobenzene, Hexachloroethane, Heptachlor epoxide, Tetrachloroethylene, Trichloroethylene, Vinyl chloride, Antimony, Anthracene, Barium, Benzene, Benzo(k)fluoranthene, Bis(2-chloroethyl)ether, Beryllium, Butyl benzyl phthalate, Carbon tetrachloride, Chloroform, Chlorobenzene, Chrysene, 3,3-Dichlorobenzidine, Dichlorobromomethane, 1,2-Dichloroethane, 1,1-Dichloroethylene, 2,4-Dichlorophenol, 1,2-Dichloropropane, Dieldrin, Diethyl phthalate, 2,4-Dinitrophenol, 2.,-Dinitrotoluene, Endosulfansulfate, Fluorene, Hexachlorobutadiene, Isophorone, Methyl bromide, Methylene chloride, Nitrobenzene, N-Nitrosodinpropylamine, N-Nitrosodiphenylamine, Phenol, ppDDD, ppDDE, Pyrene, 1,1,2,2-Tetrachloroethane, Toluene, 1,2,4-Trichlorobenzene, 1,1,1-Trichloroethane, 1,1,2-Trichloroethane, 2,4,6-Trichlorophenol
Fish Tissue – Mercury, PCB, Chlordane, Dioxin, Dieldrin, DDT and metabolites, Heptachlor, Hexachlorobenzene, Endosulfan, Endrin, Chloropyrifos, Benzoapyrene, Lindane, Mirex, Arsenic, Cadmium, Selenium,Toxaphene
* Includes parameters with monitoring data
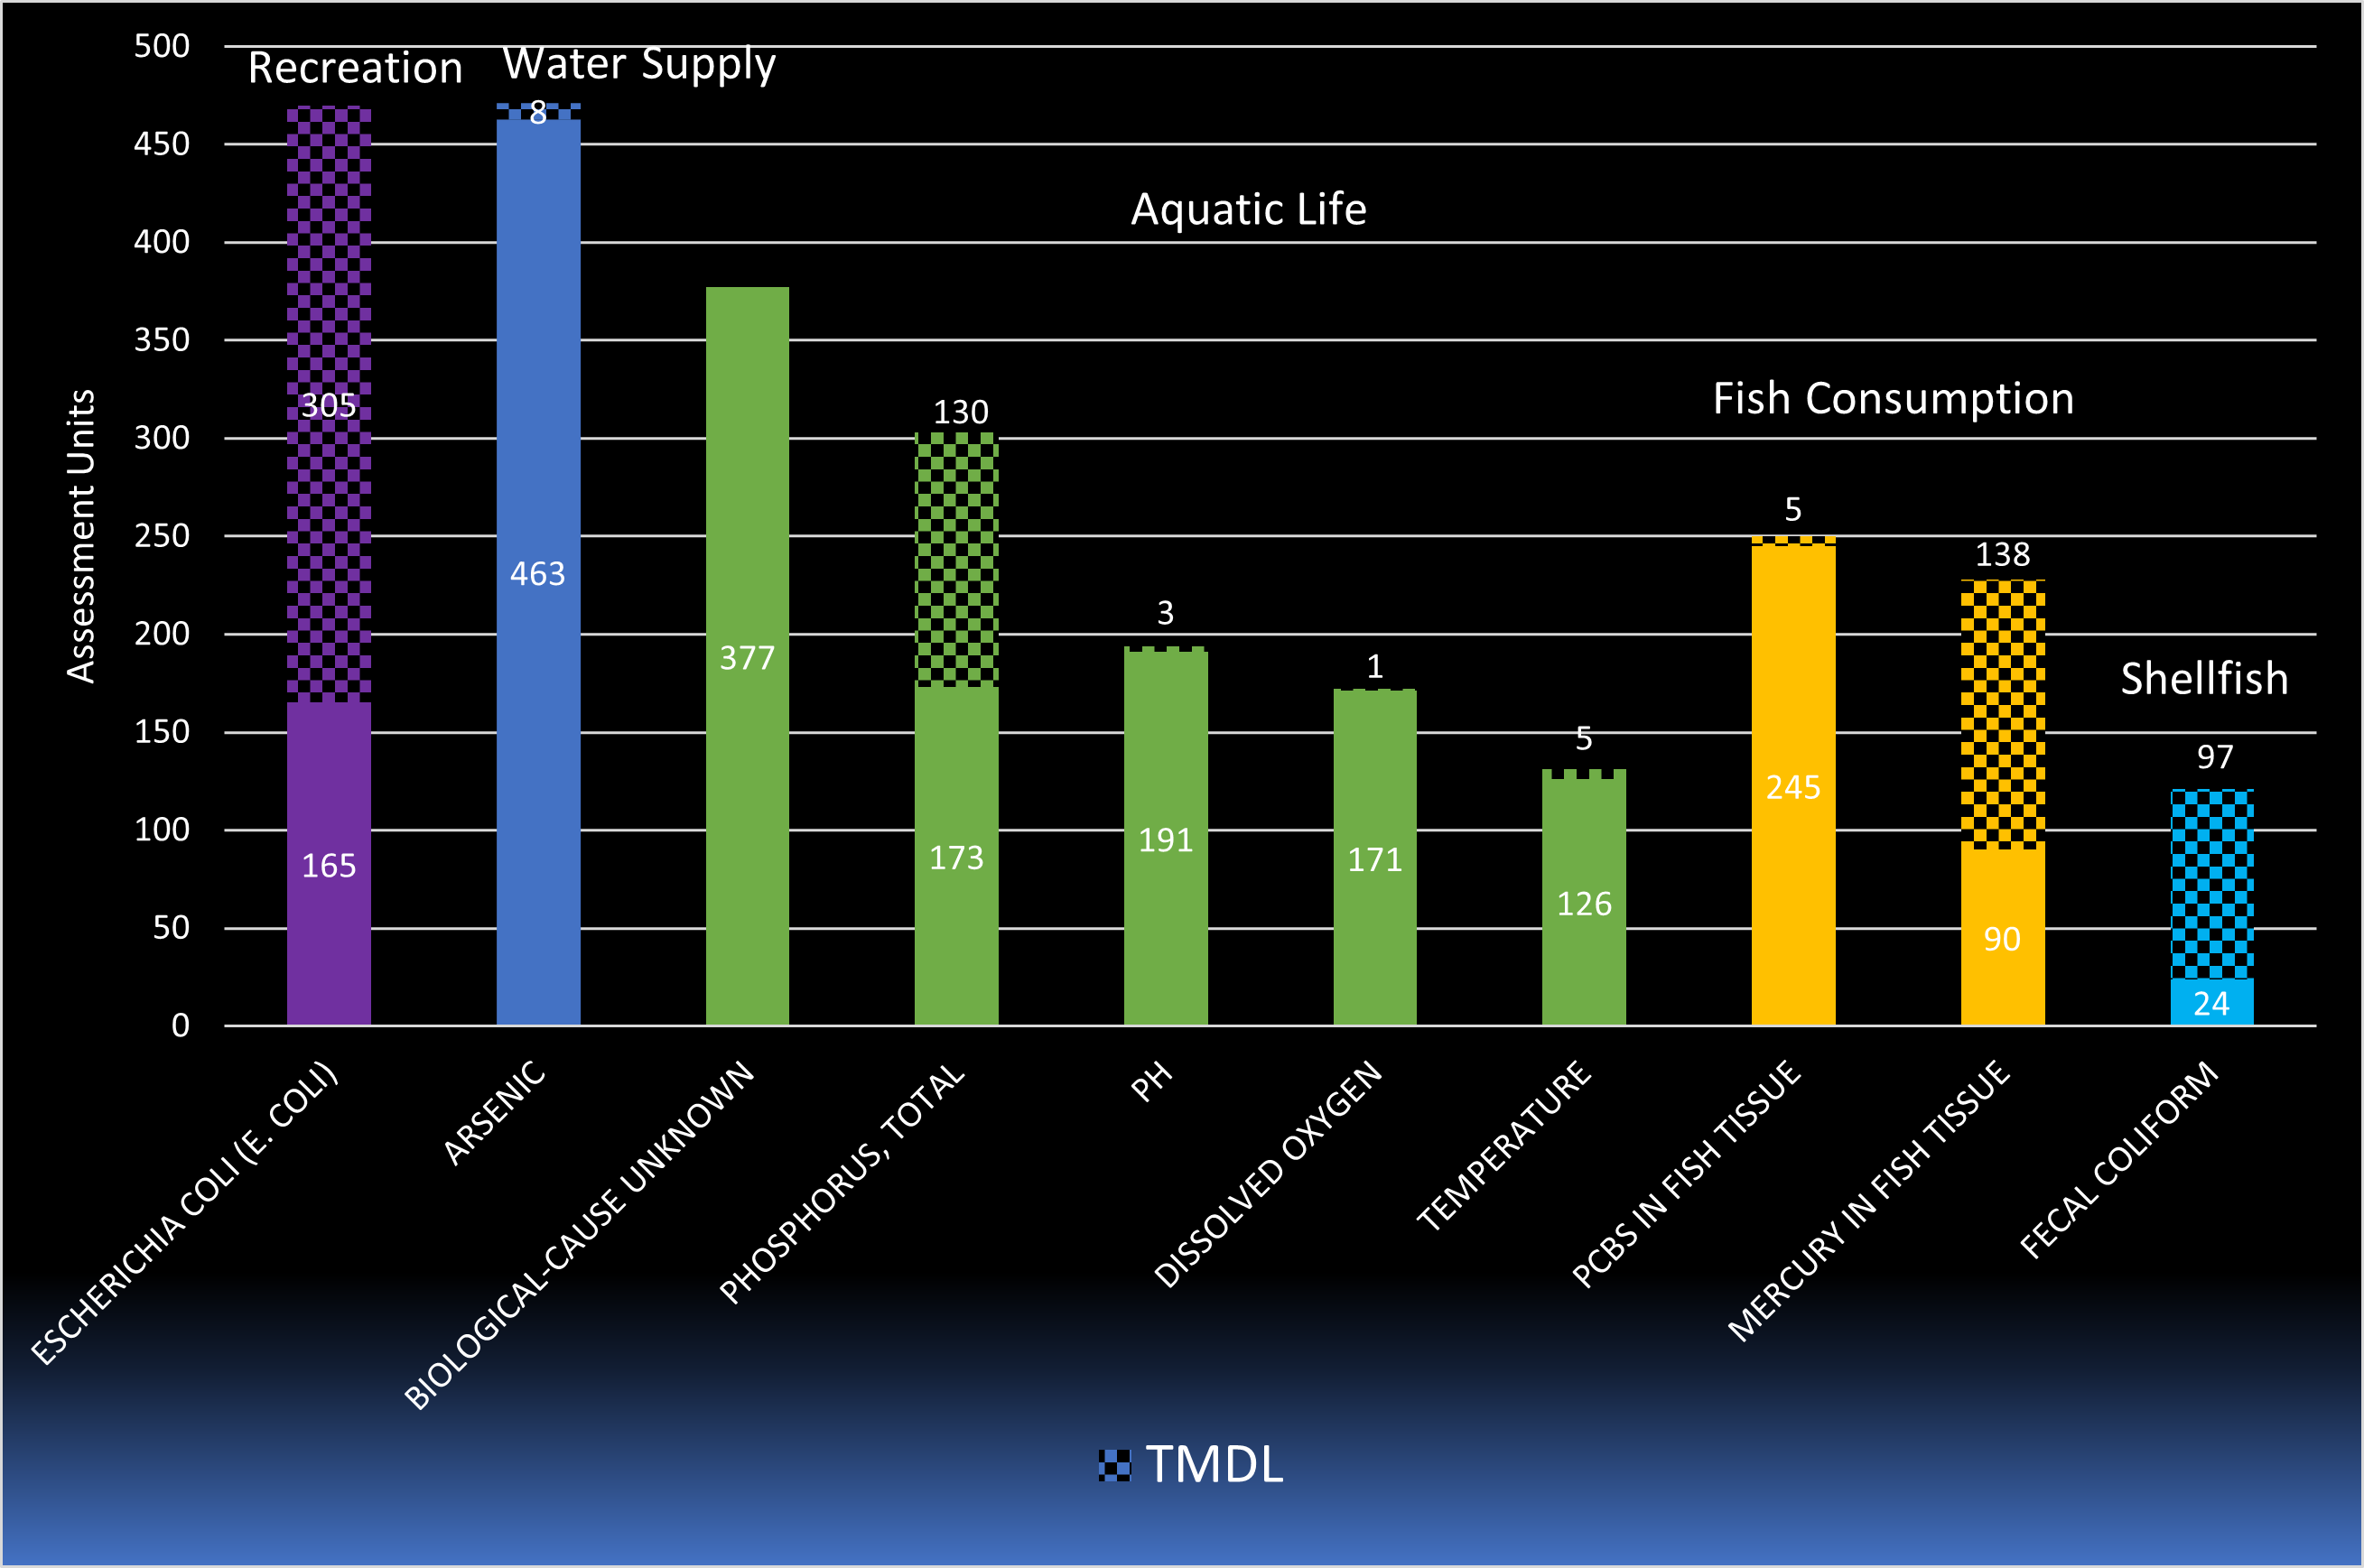
It is critical to identify the drivers of impairment in order to develop management actions to address the issues in the State’s waters.
One of the management actions the DEP uses to help restore water quality is the total maximum daily load (TMDL). TMDLs diagnose the source of the problem and quantify the water quality recovery.
A TMDL implementation plan is developed to identify a suite of measures that are needed to reduce loads from each pollutant source to levels that will meet surface water quality standards. The measures include both regulatory and non-regulatory actions.
Regulatory measures typically include effluent limitations or additional measures that are incorporated into wastewater or stormwater permits issued pursuant to the New Jersey Pollutant Discharge Elimination System (NJPDES).
Non-regulatory measures include best practices for agricultural land use, riparian restoration, and promoting watershed stewardship activities such as rain gardens and rain barrels. These can often be accomplished through receipt of grants related to nonpoint source pollution.
E. coli is one of the two most frequent cause of water quality impairment statewide and is associated with primary recreation use. In many areas, pathogen levels increase dramatically during rainfall events, indicating stormwater runoff (nonpoint sources of pollution) as the source. These sources may be from human, pet, livestock, or wildlife waste. Common causes of high e. coli levels include stormwater runoff, septic system failures, illicit sewer system connections, livestock, manure storage facilities, agricultural lands that receive manure applications, wildlife including geese, and resuspension from sediments. Most of these impairments (65%) are already covered by an approved TMDL.
Arsenic is second of the two most frequent cause of water quality impairment statewide and the predominant cause of water supply use impairments with 97% of the impaired AUs impacted by arsenic. The frequency of arsenic impairment has increased over time due to improved laboratory detection of arsenic at levels approaching the SWQS human health criterion for arsenic of 0.017 micrograms per liter (ug/L). The contamination of a drinking water source by arsenic can result from either natural or human activities. Arsenic is an element that occurs naturally in rocks and soil, water, air, plants, and animals. Although about 90 percent of the arsenic used by industry in the United States is currently used for wood preservative purposes, arsenic is also used in paints, drugs, dyes, soaps, metals and semi-conductors. Agricultural applications, mining, and smelting also contribute to arsenic releases.
Degraded biological communities have been identified as the most frequent reason for aquatic life use impairments. This indicator directly confirms the conditions for aquatic life, although causes are unknown for the biological degradations. Total phosphorus has been identified as the most frequent chemical parameter causing aquatic life impairments and has been a focus for TMDL development, with 125 TMDLs completed by the DEP to date. Dissolved oxygen and pH-caused impairments are often associated with nutrient over-enrichment that will respond to restoration efforts aimed at controlling nutrients. Nutrient enrichment from point sources (e.g., sewage treatment plants), land use practices (e.g., application of fertilizer), and land disturbance (e.g., loss of riparian buffers and increase in impervious surface), are common sources of these impairments.
High temperature levels are the predominant cause of trout aquatic life use impairments. Criteria for temperature are lower in trout waters than in other waters of the state because of the sensitivity of the target species. Agriculture, urban development, and damming of streams are the predominant cause of reducing tree canopy in a watershed and causes higher water temperatures. These disturbances also elevate nutrient levels and impact biological communities.
Bioaccumulative toxin pollutants are the major cause of restrictions on fish consumption use. PCBs and mercury are the most common bioaccumlative pollutants found in fish tissue. Although PCB is no longer manufactured, it is still used in some industries, and it has longevity in the environment. The major source of impairment for mercury is atmospheric deposition from air sources located outside the state and is an issue in the entire Northeast United States.
Bacterial contamination impacting the state’s freshwaters are also impacting shellfish harvesting areas. Fecal coliform is the indicator used to determine if bacterial levels are safe for shellfish harvesting. TMDLs have been developed for most of the AUs assessed as not supporting the shellfish harvest for consumption use (80%). These TMDL waterbodies are located exclusively in the bays and tidal rivers. Ocean waters are 100% fully supporting shellfish harvesting based on water quality data.
Go to the tables below to view all parameter results at the AU level and Station level.
Go to the link below to view the results as an interactive map. There are interactive maps for each designated use that present the designated use results along with each associated parameter result at the AU level and the stations within the AUs. Search for your results by your current location, address, municipality, or AU name.
Impaired waterbodies that have water quality parameters not attaining their criteria are listed on the 303(d) List and Sublist 4. The 303(d) List represents AUs that are not meeting their use caused by a pollutant that requires a TMDL. Sublist 4 are AUs that are not meeting their use caused by a pollutant which is addressed by a TMDL or other enforceable action that is expected to result in full support in the future. Biological impairments are a direct indicator of the health of a biological community although causes are unknown. The DEP is developing strategies to address these impairments. The complete 303(d) List and Sublist 4 for 2022 can be downloaded by selecting the links below.
2022 303(d) and Sublist 4 Parameters
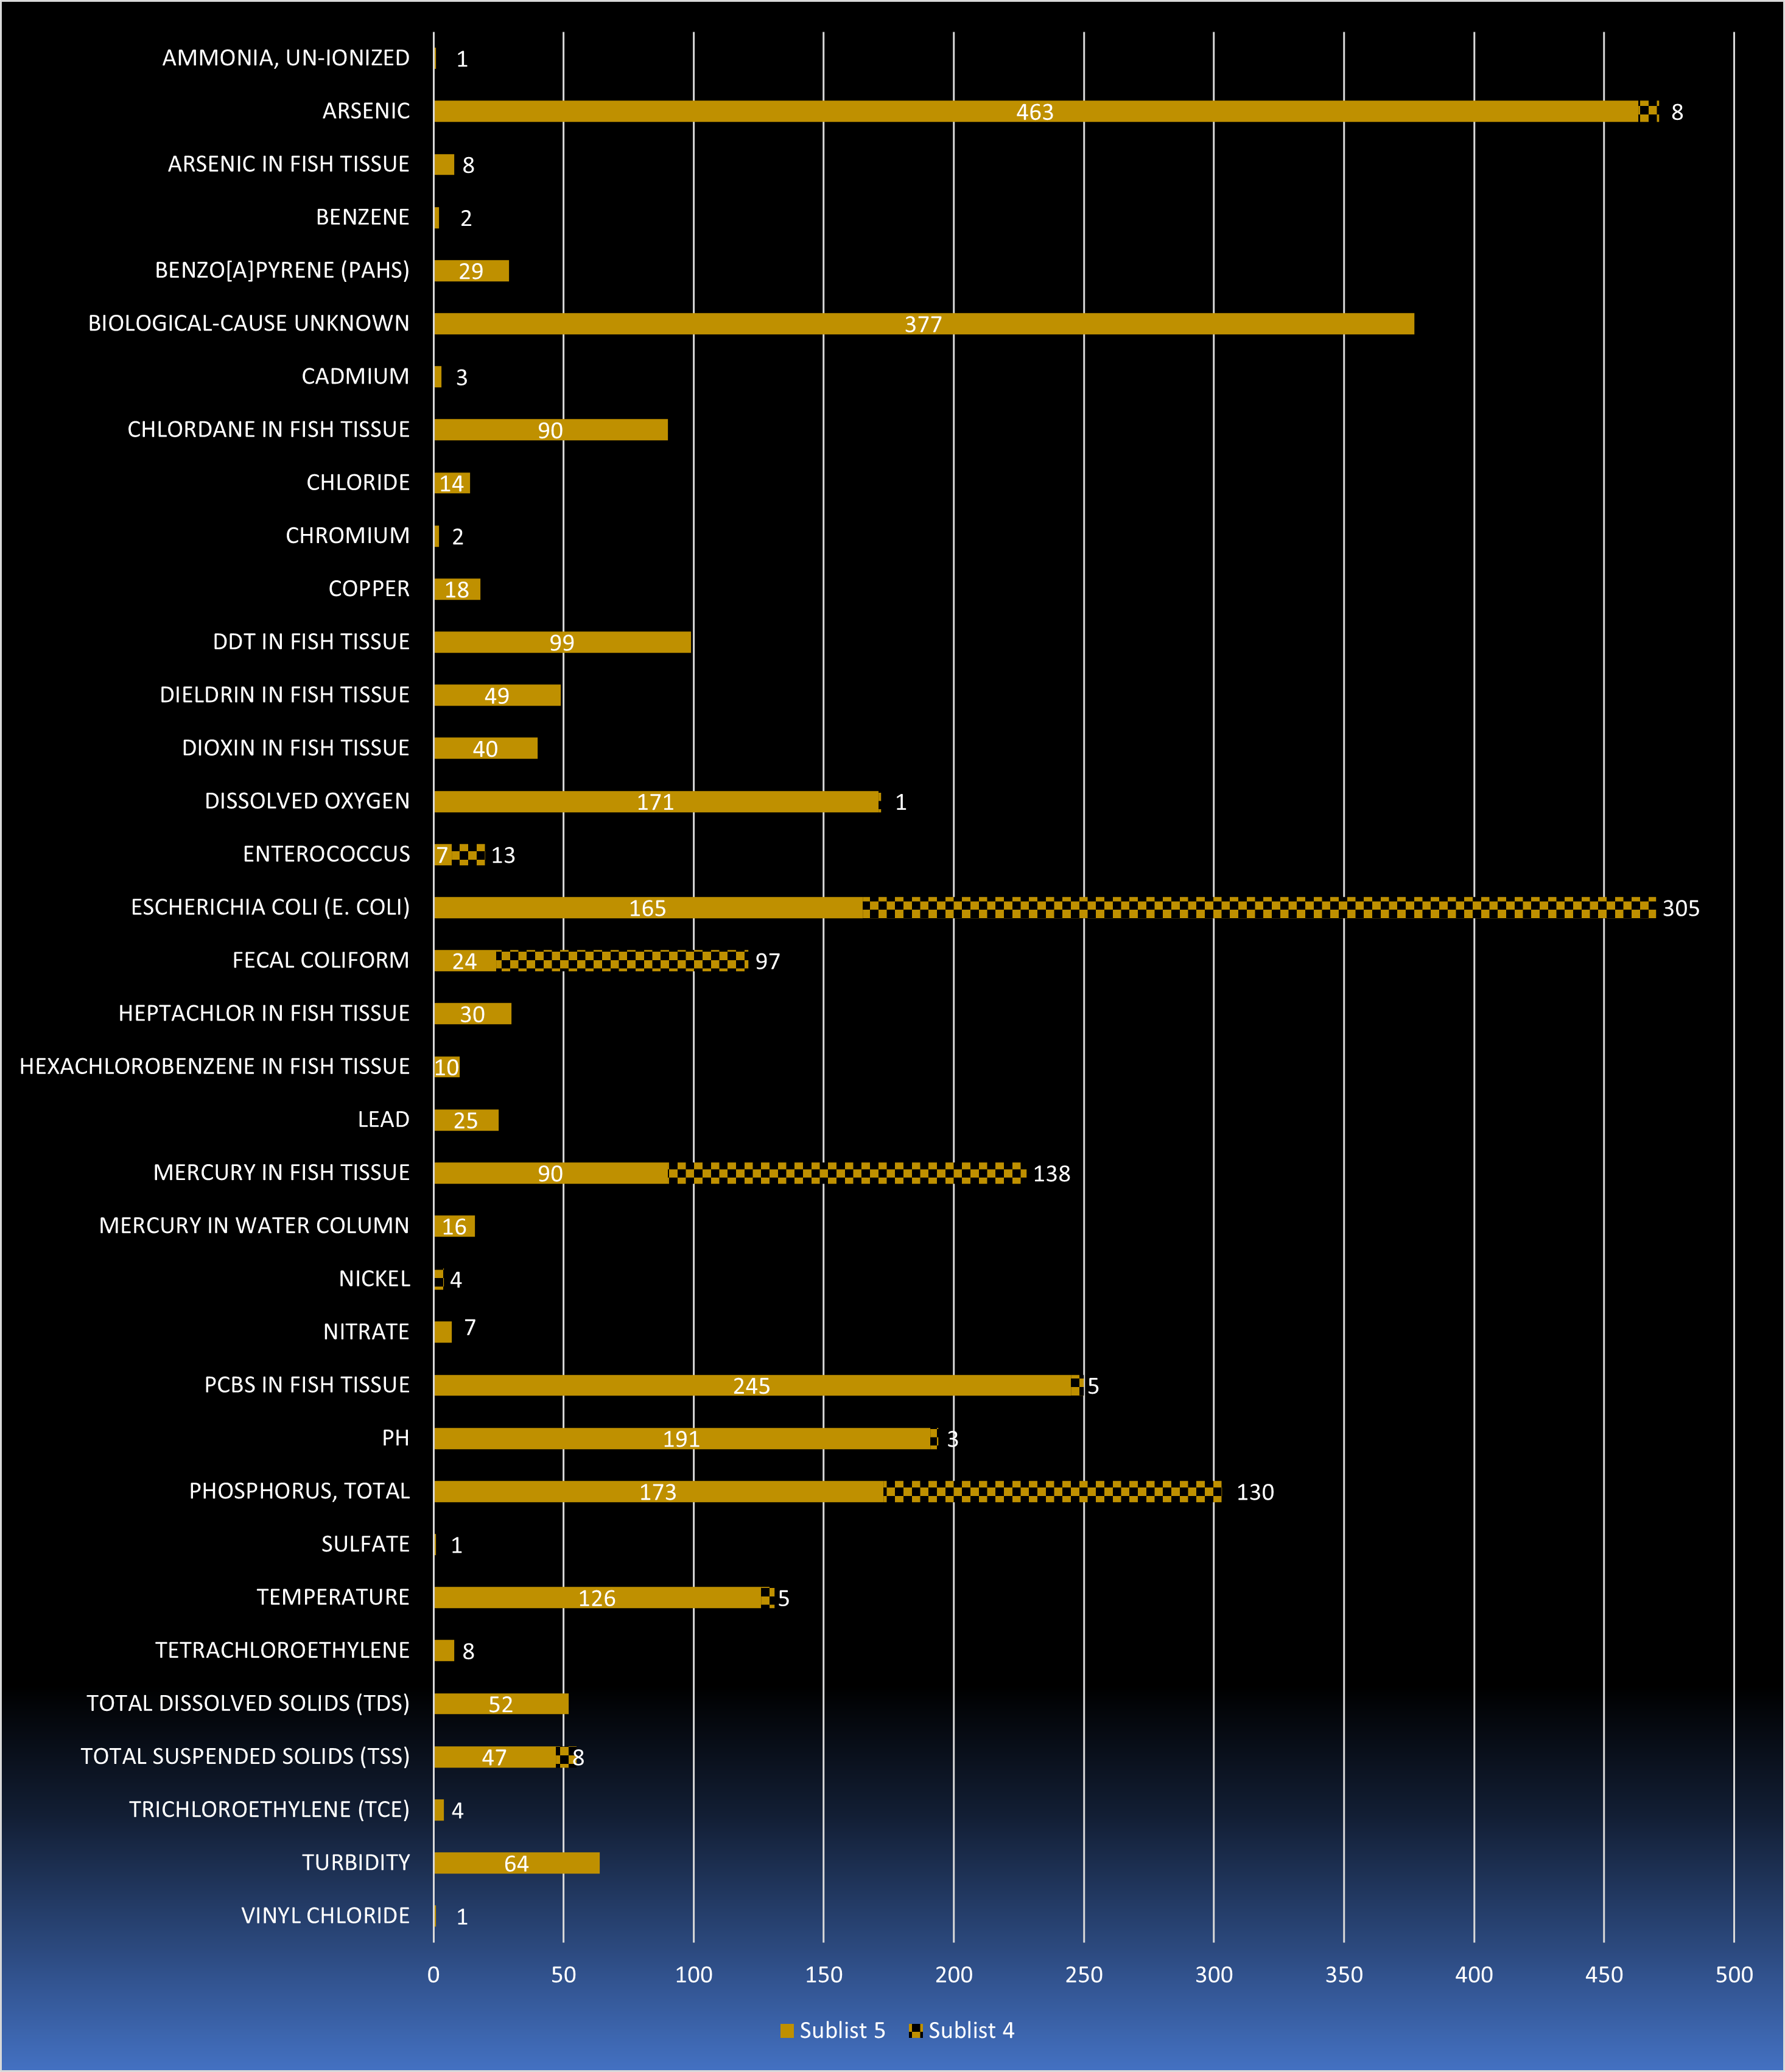
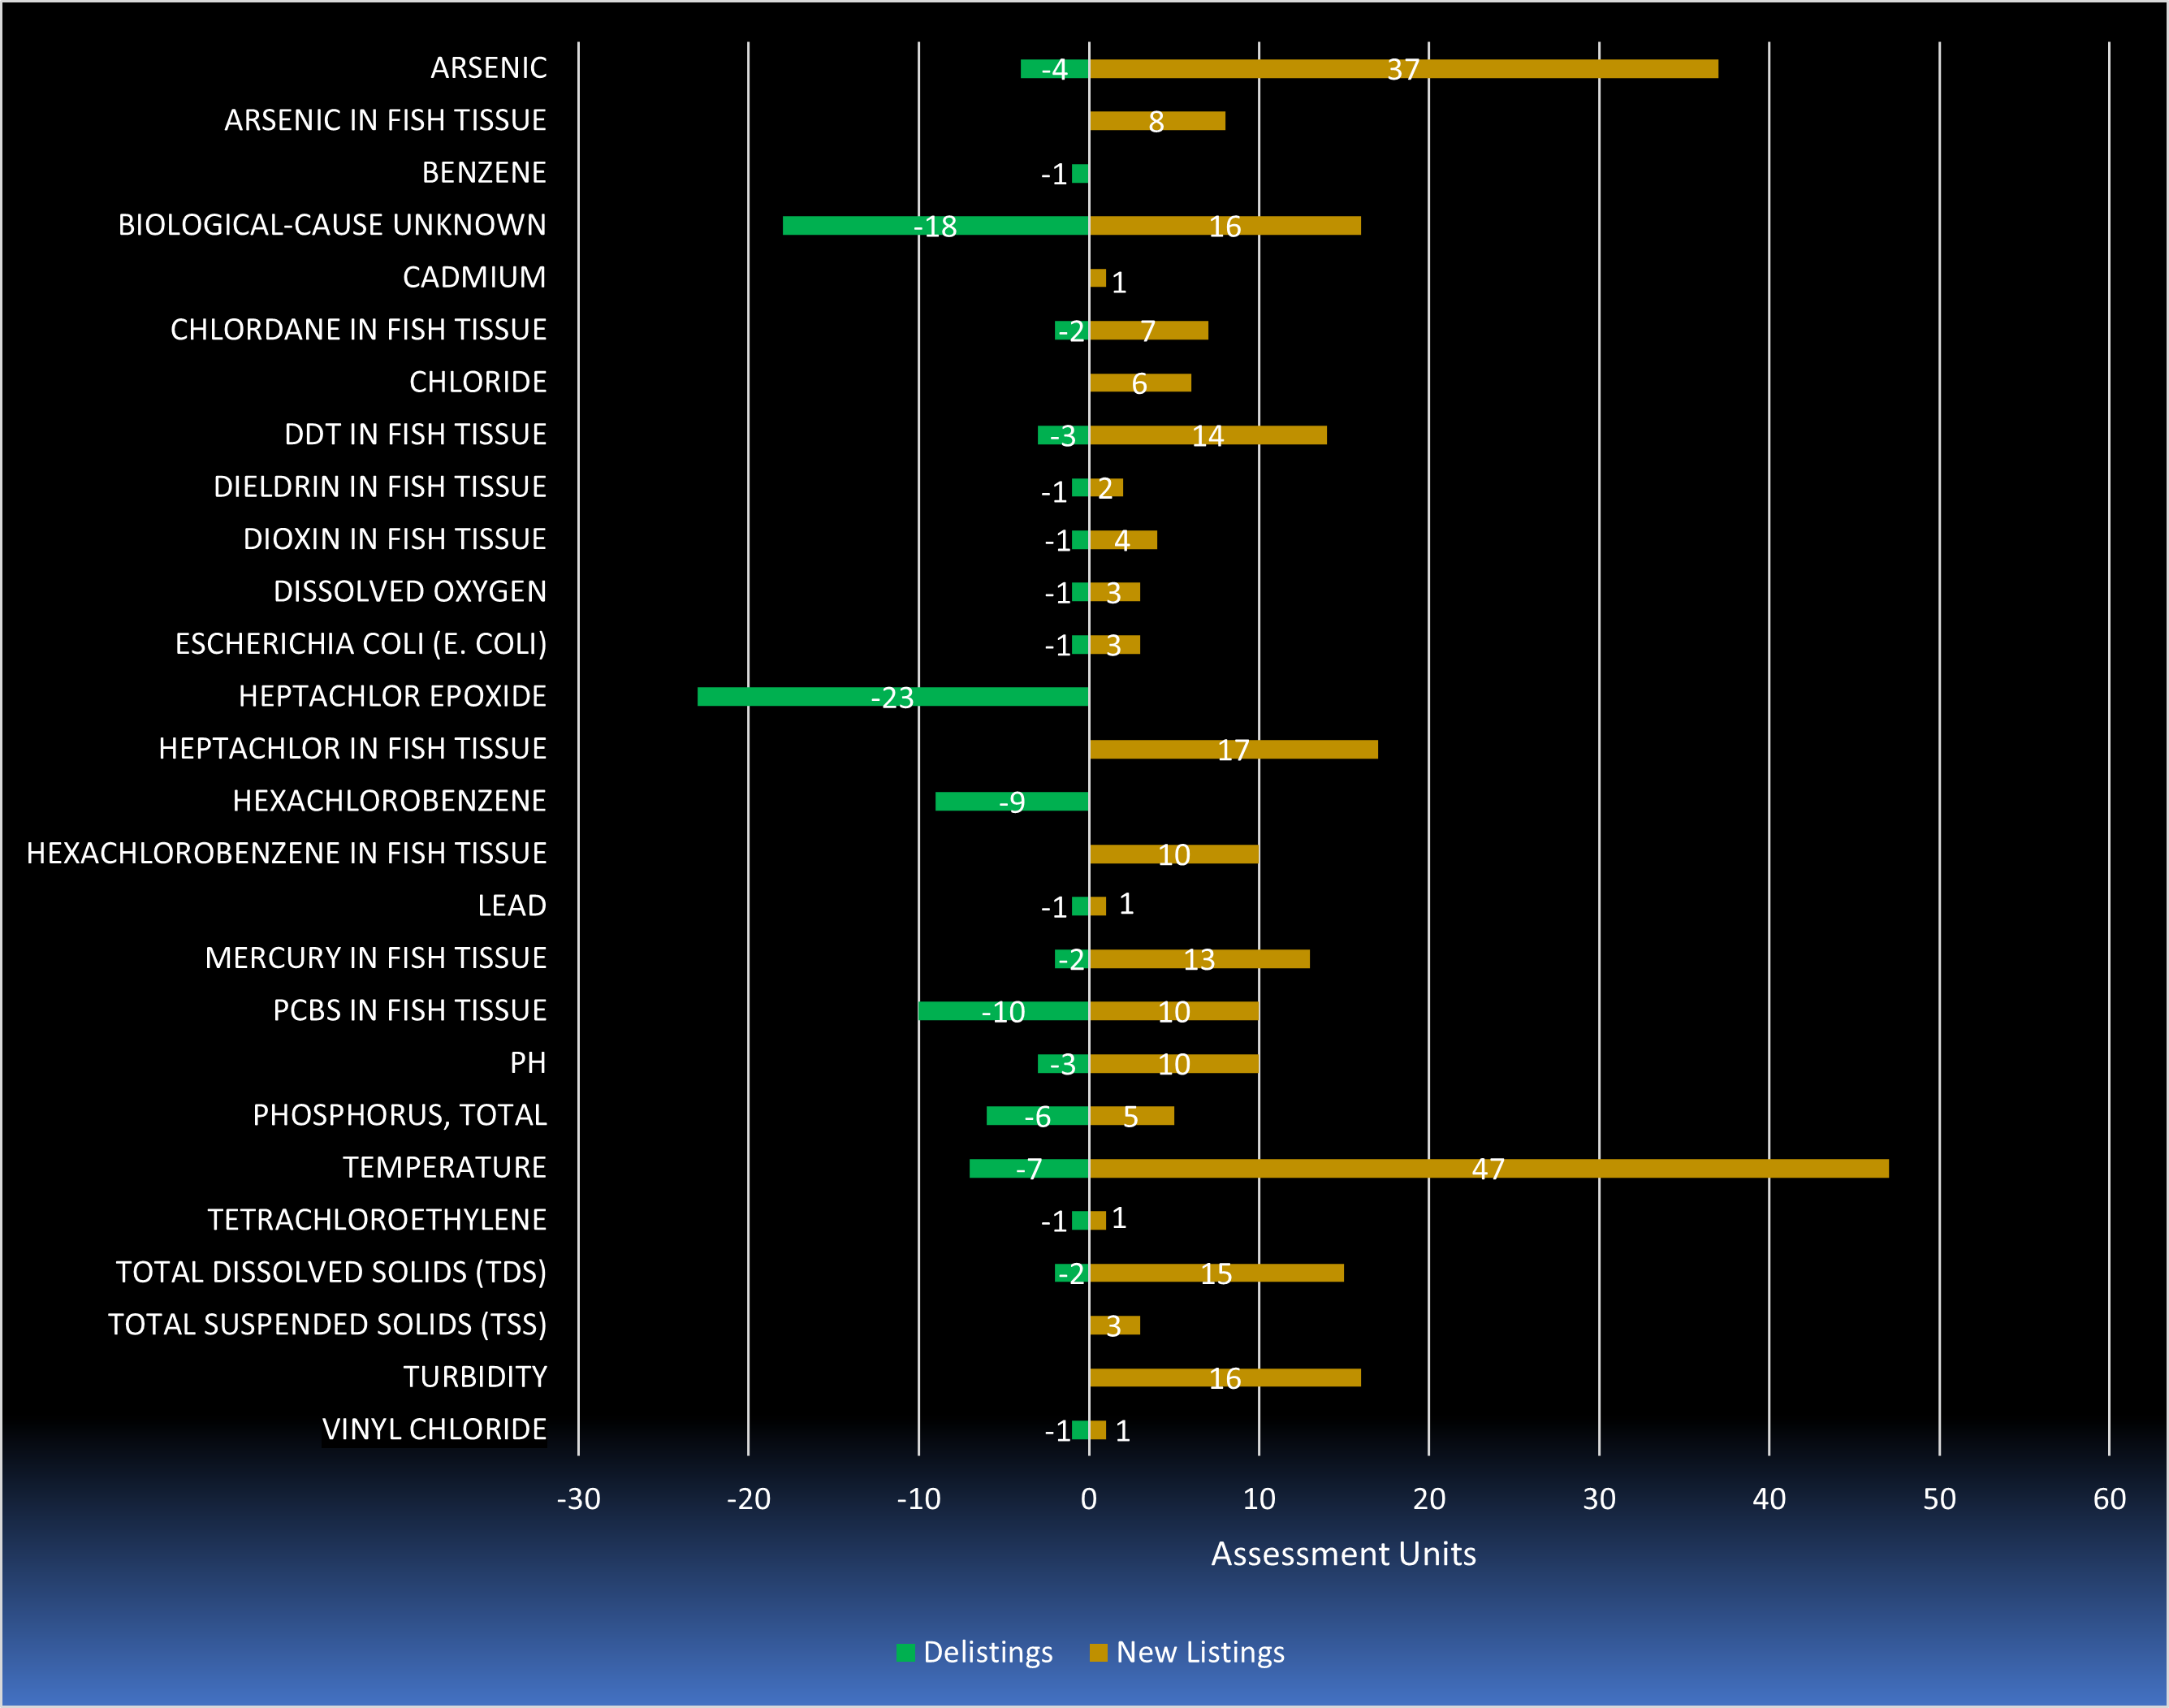
Parameter New Listings and Delistings 303(d) List
Every cycle there are changes to the Sublists including the 303(d) List and Sublist 4. All new listings are based on the latest data collected while delistings may be based on new data, TMDLs or other enforceable action moving a parameter from the 303(d) to Sublist 4, or original listing was not correct because of an error.
Reason for Delisting from the 303(d) List
| Parameter | New Data | TMDL | Original Listing Incorrect | SWQS Not Applicable |
|---|---|---|---|---|
| ARSENIC | 4 | |||
| BENZENE | 1 | |||
| BIOLOGICAL-CAUSE UNKNOWN | 10 | 8 | ||
| CHLORDANE IN FISH TISSUE | 2 | |||
| DDT IN FISH TISSUE | 3 | |||
| DIELDRIN IN FISH TISSUE | 1 | |||
| DIOXIN IN FISH TISSUE | 1 | |||
| DISSOLVED OXYGEN | 1 | |||
| ESCHERICHIA COLI (E. COLI) | 1 | |||
| HEPTACHLOR EPOXIDE | 23 | |||
| HEXACHLOROBENZENE | 9 | |||
| LEAD | 1 | |||
| MERCURY IN FISH TISSUE | 2 | |||
| PCBS IN FISH TISSUE | 4 | 6 | ||
| PH | 1 | 2 | ||
| PHOSPHORUS, TOTAL | 2 | 4 | ||
| TEMPERATURE | 6 | 1 | ||
| TETRACHLOROETHYLENE | 1 | |||
| TOTAL DISSOLVED SOLIDS (TDS) | 2 | |||
| VINYL CHLORIDE | 1 | |||
| TOTAL | 25 | 4 | 67 |
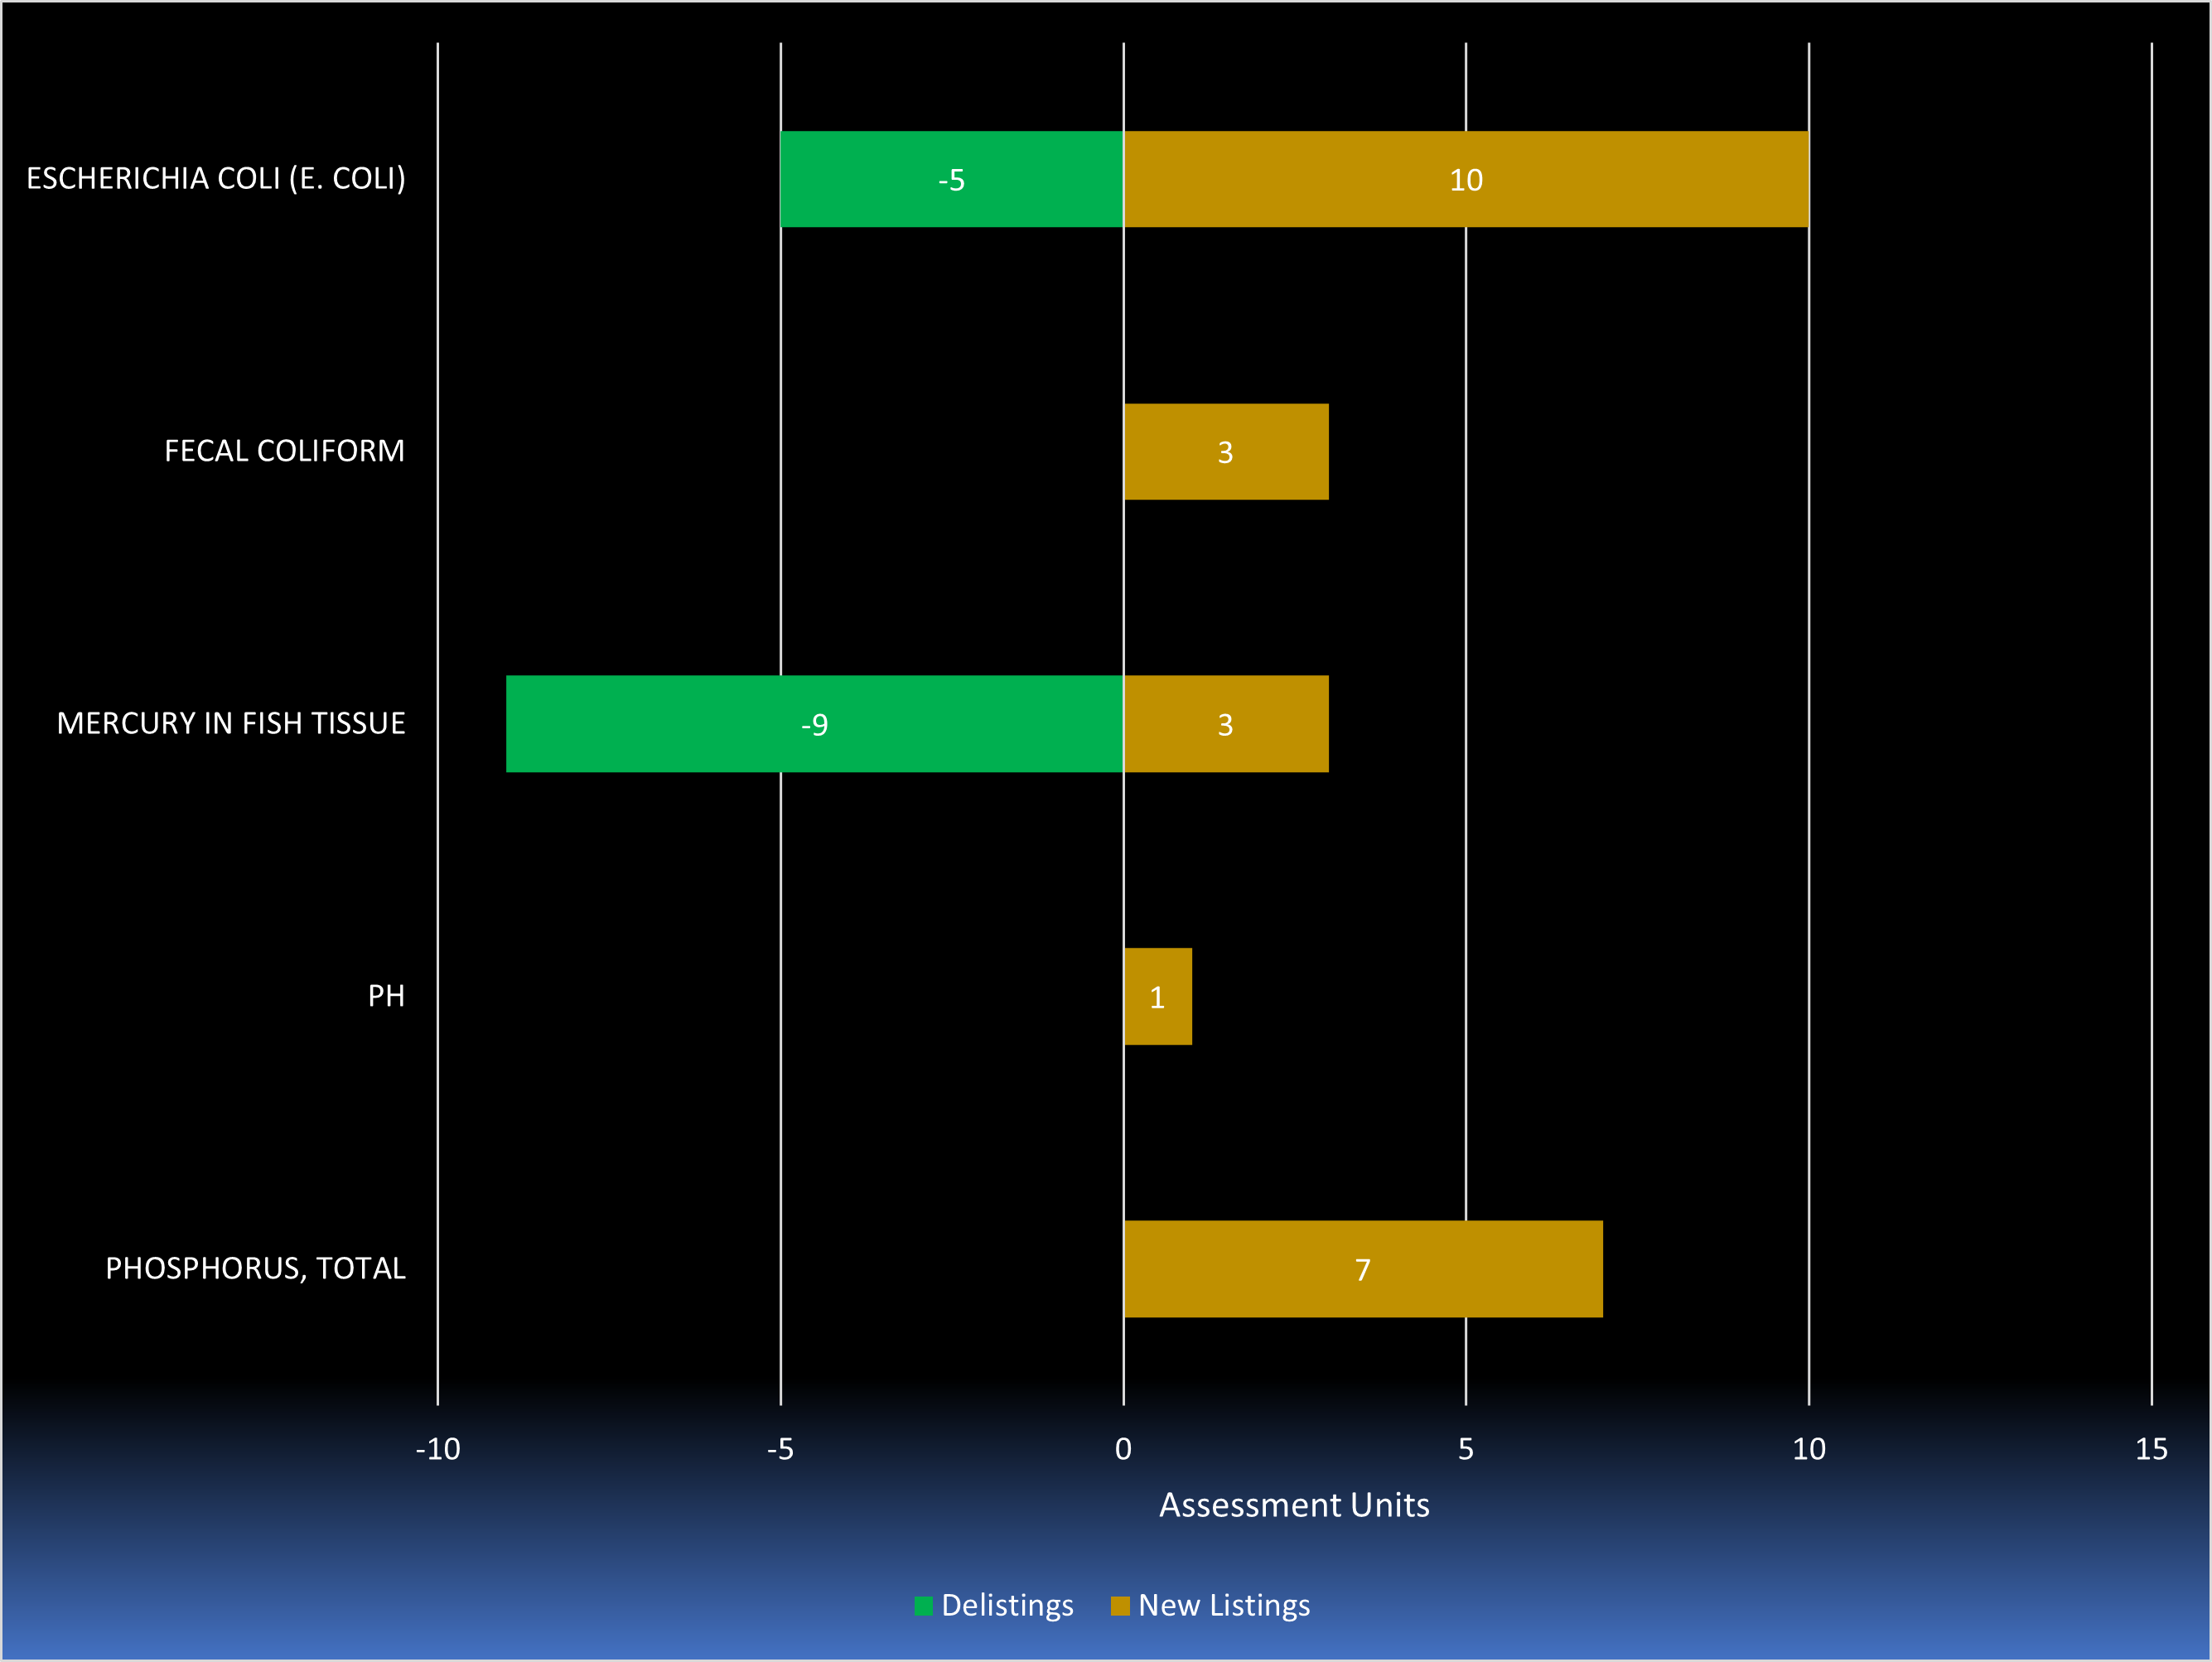
Parameter New Listings and Delistings Sublist 4
Reason For Delisting From Sublist 4
| Parameter | New Data | Original Listing Incorrect |
|---|---|---|
| ESCHERICHIA COLI (E. COLI) | 4 | 1 |
| MERCURY IN FISH TISSUE | 2 | 7 |
| TOTAL | 6 | 8 |
Much of the water quality data supporting the Integrated Report assessments are collected over a five-year to ten-year period, which provides a “snapshot” of conditions during that timeframe. Evaluating data over longer periods allows us to identify water quality trends and provides water quality changes over time to determine the effectiveness of water management programs in the State.
Most recently published in 2020, the USGS and the DEP completed new, robust statistical trend analysis demonstrating water quality trends in the state over a much longer time period than previous trend reports. Both reports cover at least a 30-year period with data from 28 physical/chemical monitoring sites distributed throughout the state. The latest report from NJDEP covers a 35-year period between 1981 to 2016 while the USGS report covers a 30-year period from 1981 to 2011.
| New Jersey Water Quality Trends | Statewide |
|---|---|
| Total Phosphorus | ▼ |
| Total Nitrogen | ▼ |
| Nitrate | ▲ |
| Total Dissolved Solids and Chloride | ▲ |
| Metals and Ammonia | ▼ |
Both long-term reports confirm decreasing concentrations for total phosphorus and total nitrogen trends; however nitrate, total dissolved solids, and chloride show increasing concentrations.
In the Northeast Water Region, a similar trend was detected except for total nitrogen which showed some increased trend results.
In a separate analysis, statewide metal and ammonia impairments reveal a significant decrease from the 303(d) List since 1998. This does not include arsenic, which continues to be detected at low levels that exceed the human health criteria.
In the Northeast Water Region, 65% of the metal and ammonia impairments have been delisted from the 1998 303(d) List.
Why?
Since the 1980s, wastewater dischargers have been regionalized and upgraded to secondary treatment, New Jersey’s Pollutant Discharge Elimination System (NJPDES) permits have reduced nutrient discharge concentrations, NJDEP nonpoint source pollution programs have been implemented, and local stewardship activities have targeted nonpoint source pollution which have all contributed to the reduction of total phosphorus and total nitrogen in our waterbodies.
Increases of nitrate in the State are attributed to ammonia reduction at wastewater treatment plants that oxidize ammonia to form nitrate, inadvertently results in increased nitrate concentrations. Ammonia is much more detrimental to the environment than nitrate because of its uptake of oxygen and its toxicity to aquatic life.
Runoff from urban and agricultural areas, including runoff of road salt used to control ice on roadways, is a major cause of increased TDS and chloride concentrations over time.
Metal and toxin improvements can be attributed to discharge limits for point source dischargers (both water and air), remediation of contaminated sites, and manufacturers closing or moving out of the state.
| Biological Trends | Statewide |
|---|---|
| Macroinvertebrate Communities | — |
| Fish Communities | — |
| Biological Trends | Northeast |
|---|---|
| Macroinvertebrate Communities | ▲ |
| Fish Communities | ▲ |
The DEP employs very robust biological monitoring networks with the benthic macroinvertebrate monitoring network being the most comprehensive including over 760 stations sampled on a five-year cycle since 1989. In 2000, the DEP initiated a fish index network consisting of over 135 stations also sampled on a five-year cycle.
In 2017, DEP reviewed the statewide biological data and updated its trends report on macroinvertebrate and fish communities. The report describes macroinvertebrate trends as moving away from excellent or poor ratings toward mostly “good”/”fair” conditions. For fish communities, conditions appear to be static with a slight negative trend.
Biological trends vary by region. Biological data collected in the Northeast Water Region show much different results than statewide trends. Macroinvertebrate and fish communities reveal slightly improving conditions in the Northeast.
Ground Water Monitoring
As a companion to its surface water monitoring program, New Jersey has developed and now maintains a cooperative ambient ground water quality monitoring network with the United States Geological Survey (USGS), consisting of 150 wells screened at the water table. To date, five full sampling cycles have been completed (and will be referred to as sampling cycles 1 through 5 in this report). The primary goals of the New Jersey ambient ground water quality monitoring network (AGWQMN) are to characterize shallow ground water quality as a function of land use and to assess shallow ground water quality trends.
Network wells are screened or open just below the water table and therefore samples from them are generally expected to represent relatively young ground water. This is the ground water that interacts with and impacts surface water quality. The final distribution of wells as a function of land use is 60 in agricultural areas, 60 in urban/suburban areas, and 30 in undeveloped land use areas.
The state of New Jersey can be separated in 4 geologically unique regions or physiographic provinces each with unique rock types, landforms and hydrogeological settings. These geological variables affect natural ground water quality. For this study, these physiographic provinces were separated into two separate areas, coastal plain and bedrock (see map).
Ground Water Quality
Ground water is mainly recharged by precipitation that percolates downward through the unsaturated zone into the zone of saturation. Ground water quality is a reflection of: 1) the starting composition of precipitation; 2) the solubility and composition of the materials that the precipitation comes in contact with on the land surface, in the unsaturated zone, and in the saturated zone; and 3) the duration of that contact. Natural geologic materials impart a geochemical character to the water contacting it that is unique to those materials. Anthropogenic contaminants or pollutants in the form of dissolved gases, chemical constituents and possibly colloids and other particles can impact ground-water quality.
Data summaries of samples collected and analyzed from the 150 AGWQMN wells between 1999 and 2019 are presented and discussed. AGWQMN wells in undeveloped areas yield ground water with a more natural quality than those in agricultural and urban areas and therefore provide a reference for water quality that is little affected by human activity.
Water Quality
The water quality parameters or constituents such as temperature, dissolved oxygen, pH, and total dissolved solids (TDS) concentration values yield information about the general character of shallow ground water as a function of geology and land use (Table F1 ). Lower pH and TDS values in the Coastal Plain reflect the difference in geologic makeup. In addition, it is generally cooler in northern New Jersey, which is reflected in the cooler shallow ground-water temperatures relative to the Coastal Plain shallow ground-water temperature in the southern portion of the State. The lower dissolved oxygen concentration in urban areas in both the bedrock and Coastal Plain may result from the large percentage of heat-absorbing impervious surface area and resulting in poorer exchange with atmospheric oxygen, and the higher surface temperature affects the density of air. A noticeable decrease in the median DO in the undeveloped land use monitoring wells in the Coastal Plain in sampling cycles 3 and 5 was observed. However, this decrease is not significant at the 95% confidence level when compared to the median DO concentrations in sampling cycle 1 and 2. Increased total dissolved solids concentrations in agricultural and urban areas are most likely due to road salt and agrochemical applications. Many wells in agricultural land use areas are also near roads and therefore their water quality can also be impacted by road salt.
Trace Elements
Ground-water samples were analyzed for the following 15 trace elements (metals): aluminum, antimony, arsenic, barium, beryllium, boron, cadmium, chromium, copper, iron, lead, manganese, mercury, nickel, and selenium. Of these, eight trace elements (arsenic, beryllium, cadmium, iron, lead, manganese, nickel, and aluminum) have been detected at concentrations greater than the New Jersey Ground Water Quality Standards (GWQS) in all five sampling cycles except nickel was not detected above the GWQS in cycles 1 and 3.
In the Coastal Plain of New Jersey (southern NJ), iron and aluminum are most likely natural in origin. As observed in the bedrock provinces monitoring wells, manganese has an urban and agricultural land use association. The reducing conditions found in the agricultural and urban land use areas, indicated by the lower dissolved oxygen concentrations found in these land use areas, are conducive to iron and manganese mobility. Acidic and reducing ground-water conditions will mobilize the iron, aluminum, and manganese.
Arsenic detected in ground water in the bedrock provinces are generally natural in origin. The number of detections that exceed the NJ Ground Water Quality Standard ranged from 7 to 11 of the bedrock provinces wells during the 5 sampling cycles.
Arsenic was detected above the GWQS in all land uses in the Coastal Plain though the detections were infrequent. The highest arsenic concentrations were detected in urban land use with a maximum concentration of 111.53 µg/L. The ultimate source of this arsenic is unknown. An elevated arsenic concentration could potentially be attributed to a high degree of iron-oxide dissolution. One potential source of naturally occurring arsenic in the Coastal Plain could be glauconitic sediments, sometimes called greensands.
In the Coastal Plain, mercury was detected at low levels generally less than 1 µg/L with the exception of a detection of 7.14 µg/L at one well in sampling cycle 5, which exceeds the GWQS of 2 µg/L. Fertilizers, agrochemicals, and lawn care products could be the source or mobilization agent for the beryllium, cadmium, lead, and nickel observed in the Coastal Plain.
Nutrients
Nutrient concentrations are dominated by nitrate, and the frequency and concentration by land use in both the bedrock provinces (northern NJ) and the Coastal Plain (southern NJ) are agricultural greater than urban, which is greater than undeveloped (Table F2 ) in all the sampling cycles. Most of the concentrations of nitrite plus nitrate as milligrams per liter (mg/L) of nitrogen that exceed the GWQS of 10 mg/L were observed in the agricultural land use monitoring wells. The use of nitrogen-based fertilizers in agricultural and urban areas and possibly septic system and sewer system leakage are considered to be the major sources. In the first four sampling cycles, orthophosphate concentrations were all less than 1.0 mg/L. In cycle 5, three monitoring wells had concentrations greater than 1.0 mg/L with a maximum concentration of 2.58 mg/L as phosphorous. Two of these wells were in agricultural land use areas while the third is classified as urban land use.
Volatile Organic Compounds and Pesticides
The ground-water samples were analyzed for 35 volatile organic compounds (VOCs). The frequency of VOC detection is a function of land use. Figure F2 shows the percentage of monitoring wells per sampling cycle that had at least one VOC detection. Of the three land uses, the samples from the urban land use monitoring wells generally had the highest frequency of detection of VOCs. It should be noted that a high percentage of undeveloped wells in the Coastal Plain had detections for one compound, chloroform (trichloromethane). Aside from chloroform detections, the frequency of VOC detection in undeveloped land use areas is relatively low. The presence of chloroform in groundwater can be potentially attributed to atmospheric deposition, septic systems, leaking sewers and water lines, or chlorinated drinking water being used to water lawns and gardens and to fill up swimming pools. In addition to these anthropogenic sources, chloroform can potentially be produced through natural processes in soil.
Methyl tertiary-butyl ether (MTBE), an additive in gasoline, showed a steep decline in the frequency of detection, especially in the bedrock provinces between sampling cycles 1 and 2. There were no detections above the GWQS of 70 µg/L in the Coastal Plain or bedrock provinces and the maximum detected concentration was 47.13 µg/L in sampling cycle 1. The frequency of detection remained steady between sampling cycle 2 and 5 with one detection in the bedrock provinces. During the first round of sampling 50% of the urban wells, 14% of agricultural wells, and 9% of the wells in undeveloped land use had detections for MTBE. In sampling cycles 2 through 5 there was only one detection of MTBE in each sampling cycle, but the detection was observed in a different well in each of cycles 2 to 4, one from each land use.
In the Coastal Plain, the frequency of MTBE detection decreased between sampling cycles from 18% of wells with detections in cycle 1 to 7% of wells with detections in cycle 5. The decrease in detections of MTBE can be attributed to a ban on using MTBE in the State of New Jersey. The Coastal Plain has more detections of MTBE than the bedrock provinces, which could possibly be due to atmospheric deposition. The predominant wind patterns are from the north-west, and the heavily urbanized areas of New Jersey’s bordering States to the west could be one reason for the observed higher detections of MTBE in the Coastal Plain than in the bedrock provinces. In the agricultural land use wells in the Coastal Plain, the frequency of detection of MTBE decreases to zero in sampling cycles 4 and 5. Figure F2 shows a decreasing trend of VOC detection frequency in agricultural land use wells in the Coastal Plain. In sampling cycle 5, there was only one well with a VOC detection, which was of a single compound, toluene.
Pesticides
The concentration and frequency of detections of pesticides Statewide is land use driven with agricultural land use the primary source. The number of compounds detected fluctuates over the five sampling cycles. During sampling of the bedrock provinces monitoring wells in cycle 2, there was a change in the pesticide parameter list. The new parameter list contains more metabolite compounds that were not previously analyzed for. As of sampling cycle 5, 80 pesticide compounds are included in the analysis. There were detections of 33 of the 80 compounds in cycle 5. Atrazine and its degradation product 2-chloro-4-isopropylamino-6-amino-s-triazine (deethylatrazine), metolachlor, prometon, and simazine are herbicides used to control grasses and broadleaf plants. These compounds have been detected in all sampling cycles.
Radionuclides
Gross alpha particle activity was analyzed within 48 hours after sample collection. This ensures that the radioactive decay of short-lived radium-224 (half-life of 3.64 days) is measured along with the other alpha emitters. The Federal and New Jersey drinking water standard of 15 pCi/L gross alpha particle activity still applies even though the shorter holding time results in increased activity if significant radium-224 is present. Generally, higher radium activity is found in the Coastal Plain Physiographic Province versus the bedrock provinces in all land uses. This is most likely due to the greater abundance of radium-224 and the low pH of the ground water in the Coastal Plain. The low pH can increase radium’s mobility. In both the combined bedrock and Coastal Plain provinces, and in all sampling cycles, the highest activity is associated with agricultural and urban land use areas. The application of agricultural and lawn chemical products can compete with naturally occurring radium for adsorption sites thereby mobilizing more into the ground-water system. In the Coastal Plain, the frequency of gross alpha concentrations above the standard ranged between 11% and 20% over the five sampling cycles with a generally increasing trend. In the bedrock provinces, there was only one monitoring well sample that exceeded the standard in sampling cycles 2 and 4, but these were not at the same well. No samples from monitoring wells in bedrock provinces exceeded the standard in sampling cycles 1, 3, and 5.
Per- and Polyfluoroalkyl Substances (PFAS)
To develop a general understanding of the occurrence of PFAS throughout New Jersey, sampling for PFAS was added for the sixth sampling cycle beginning in 2020 and is planned to continue through the seventh sampling cycle beginning in 2023. Data for the monitoring wells sampled in 2020 (sampling set 1) and 2021 (sampling set 2) are summarized in this section. Analytical results for sampling set 3 (2022) are not yet available, so the 50 wells in sampling set 3 are not included in this summary. The monitoring wells of sampling sets 1 and 2 are located in portions of Atlantic, Burlington, Camden, Cape May, Cumberland, Gloucester, Hunterdon, Mercer, Middlesex, Monmouth, Ocean, Salem, and Somerset counties.
Forty-nine monitoring wells were sampled for PFAS in 2020, and 50 monitoring wells were sampled in 2021. Groundwater samples were analyzed for 28 PFAS compounds using a lab-specific modified version of U.S. EPA Method 537 using liquid chromatography and tandem mass spectrometry with isotopic dilution (SGS Orlando method LCID537 AQ). Seventeen of the 28 compounds analyzed for were detected as summarized in Table F3 . Of the 99 wells sampled, 70 had detections of PFAS. The maximum concentration of any compound detected was 370 ng/L of PFBS. The analyte HFPO-DA associated with the replacement compound GenX was detected in 3 wells. Replacement compounds F-53B and ADONA were not detected in the wells sampled.
Every monitoring well classified as urban land use had one or more detections of PFAS. For the agricultural land use classification, at least one compound was detected in 94% of the wells sampled. The land use classification with the fewest PFAS detections was undeveloped land use; 47% of wells sampled had at least one compound detected.
The three PFAS compounds with NJ MCLS are PFNA, PFOA, and PFOS (13 ng/L, 14 ng/L, and 13 ng/L, respectively). Of the 49 wells sampled, 24 wells had concentrations that exceeded the MCL for one or more compounds. Of the 24 wells where concentrations exceeded MCLs, two wells had exceedances of the MCLs for both PFOA and PFNA, three wells had exceedances of the MCLs for both PFOA and PFOS, 14 wells exceeded the MCL for PFOA alone, and 5 wells exceeded only the MCL for PFOS. Eleven of these 24 wells are located in urban land use areas, nine of these wells are in agricultural land use areas, and four of these wells are in undeveloped land use areas.