
NJ Integrated Water Quality Assessment Report 2022 – Northeast Water Region
Clean Water Act 303(d) List & 305(b) Report

Aquatic Life General

Aquatic Life Trout

Primary Recreation

Secondary Recreation

Water Supply

Shellfish

Fish Consumption
Designated Use Results for Northeast Region
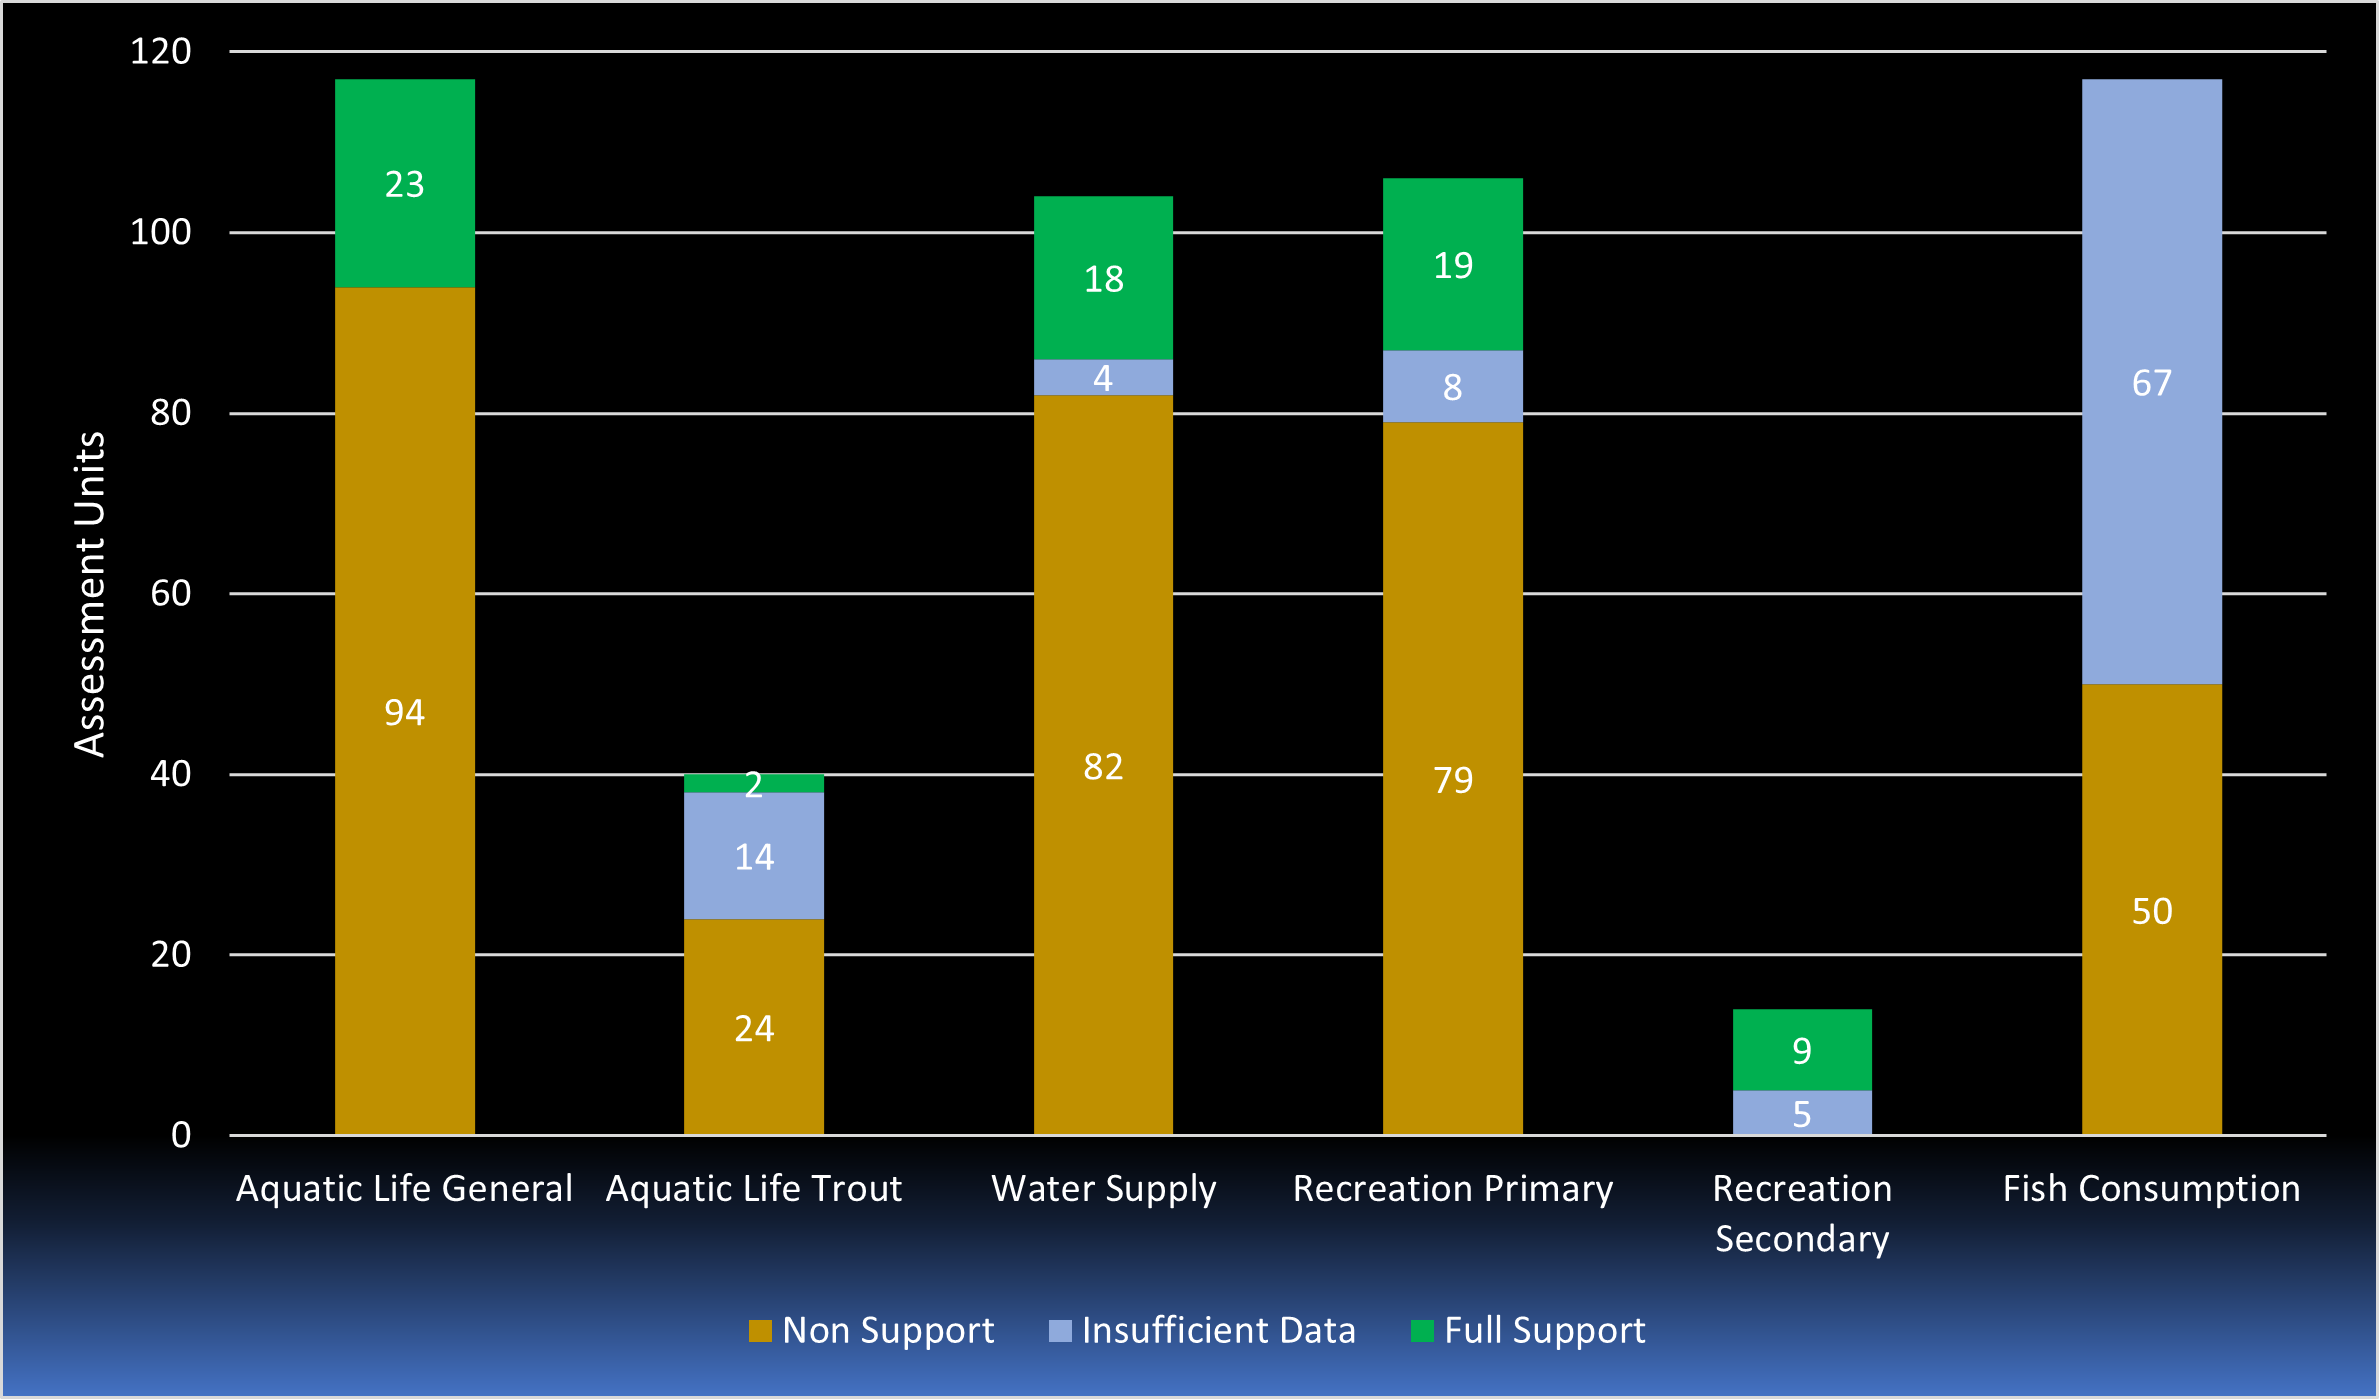
Designated use results in the Northeast Water Region present a similar pattern to statewide conditions but with a lower insufficient data results due to increased monitoring in the region. The increased sampling has resulted in a higher percentage of AUs not attaining its designated use especially for water supply designated use where arsenic is impacting the use throughout the region. Shellfish harvest for consumption is not a designated use for AUs in the Northeast Water Region, so a percentage is not shown.
| Aquatic Life General | Aquatic Life Trout | Water Supply | Recreational Primary | Recreational Secondary | Fish Consumption | Shellfish | ||||||||
|---|---|---|---|---|---|---|---|---|---|---|---|---|---|---|
| State | Northeast Region | State | Northeast Region | State | Northeast Region | State | Northeast Region | State | Northeast Region | State | Northeast Region | State | Northeast Region | |
| Full Support | 20% | 20% | 15% | 5% | 28% | 17% | 25% | 18% | 50% | 64% | 1% | 0% | 18% | NA% |
| Insufficient Data | 11% | 0% | 22% | 35% | 14% | 4% | 23% | 7% | 50% | 36% | 63% | 57% | 13% | NA |
| Non Support | 69% | 80% | 64% | 60% | 58% | 79% | 52% | 75% | 0% | 0% | 36% | 43% | 70% | NA |
Although designated use results in the table above are similar, noticeable disparities are partially explained by better monitoring coverage that allows for more complete assessment decisions in the Northeast Water Region. One exception to this observation is for aquatic life trout use where insufficient data results were 33% versus 22% statewide. Water quality conditions for several designated uses show slightly higher percentages of nonsupport. This is both an artifact of the more complete monitoring coverage and the notable elevated density of development and human-based, historical and ongoing pollutant sources in northeastern NJ.
Land use within the Northeast Water Region shows a high percentage (51%) of urban and residential land with only 28% of the land is undeveloped. For comparison, urban and residential land equals approximately 29% statewide. The combination of assorted anthropogenic water pollutants and less intact riparian buffers is noticeable in Northeast Water Region data (e.g. aquatic life conditions show substantial stress).
The Department recently promulgated additional protection and restoration in environmental justice (EJ) communities. Details are available on the Department’s EJ site -> https://njdepwptest.net/ej/
From a review of the Northeast Water Region, the area exhibits a higher relative concentration of over-burdened communities than other water regions in NJ. To incorporate the EJ initiative into this 2022 water quality status report, the following is being implemented:
- NJDEP is conducting special outreach to communicate and collect input this assessment cycle within EJ communities.
- NJDEP performed an analysis of the relative density of monitoring stations present in EJ communities for water quality assessment to ensure adequate coverage and inform decisions. The EJ areas are well covered by sampling efforts. (EJ areas include 2,168 monitoring stations within 1,610 square miles = 1.35 sites / square mile. Across NJ there are 11,712 monitoring stations within 8,920 square miles = 1.31 sites / square mile.) Coverage density is very comparable.
- NJDEP is strengthening protection and restoration resources for EJ areas. The Recover Potential Screening (RPS) tool is updated to include EJ weighting factors for project funding. Please see the additional information tab for more details on these efforts.
Go to the link below to view the results as an interactive map. There are interactive maps highlighting the Northeast Water Region for review of each designated use results along with each associated parameter result at the AU level and the stations within the AUs. Search for results by your current location, address, municipality, or AU name.
Changes to Designated Use
Northeast Designated Use Changes From 2020 to 2022
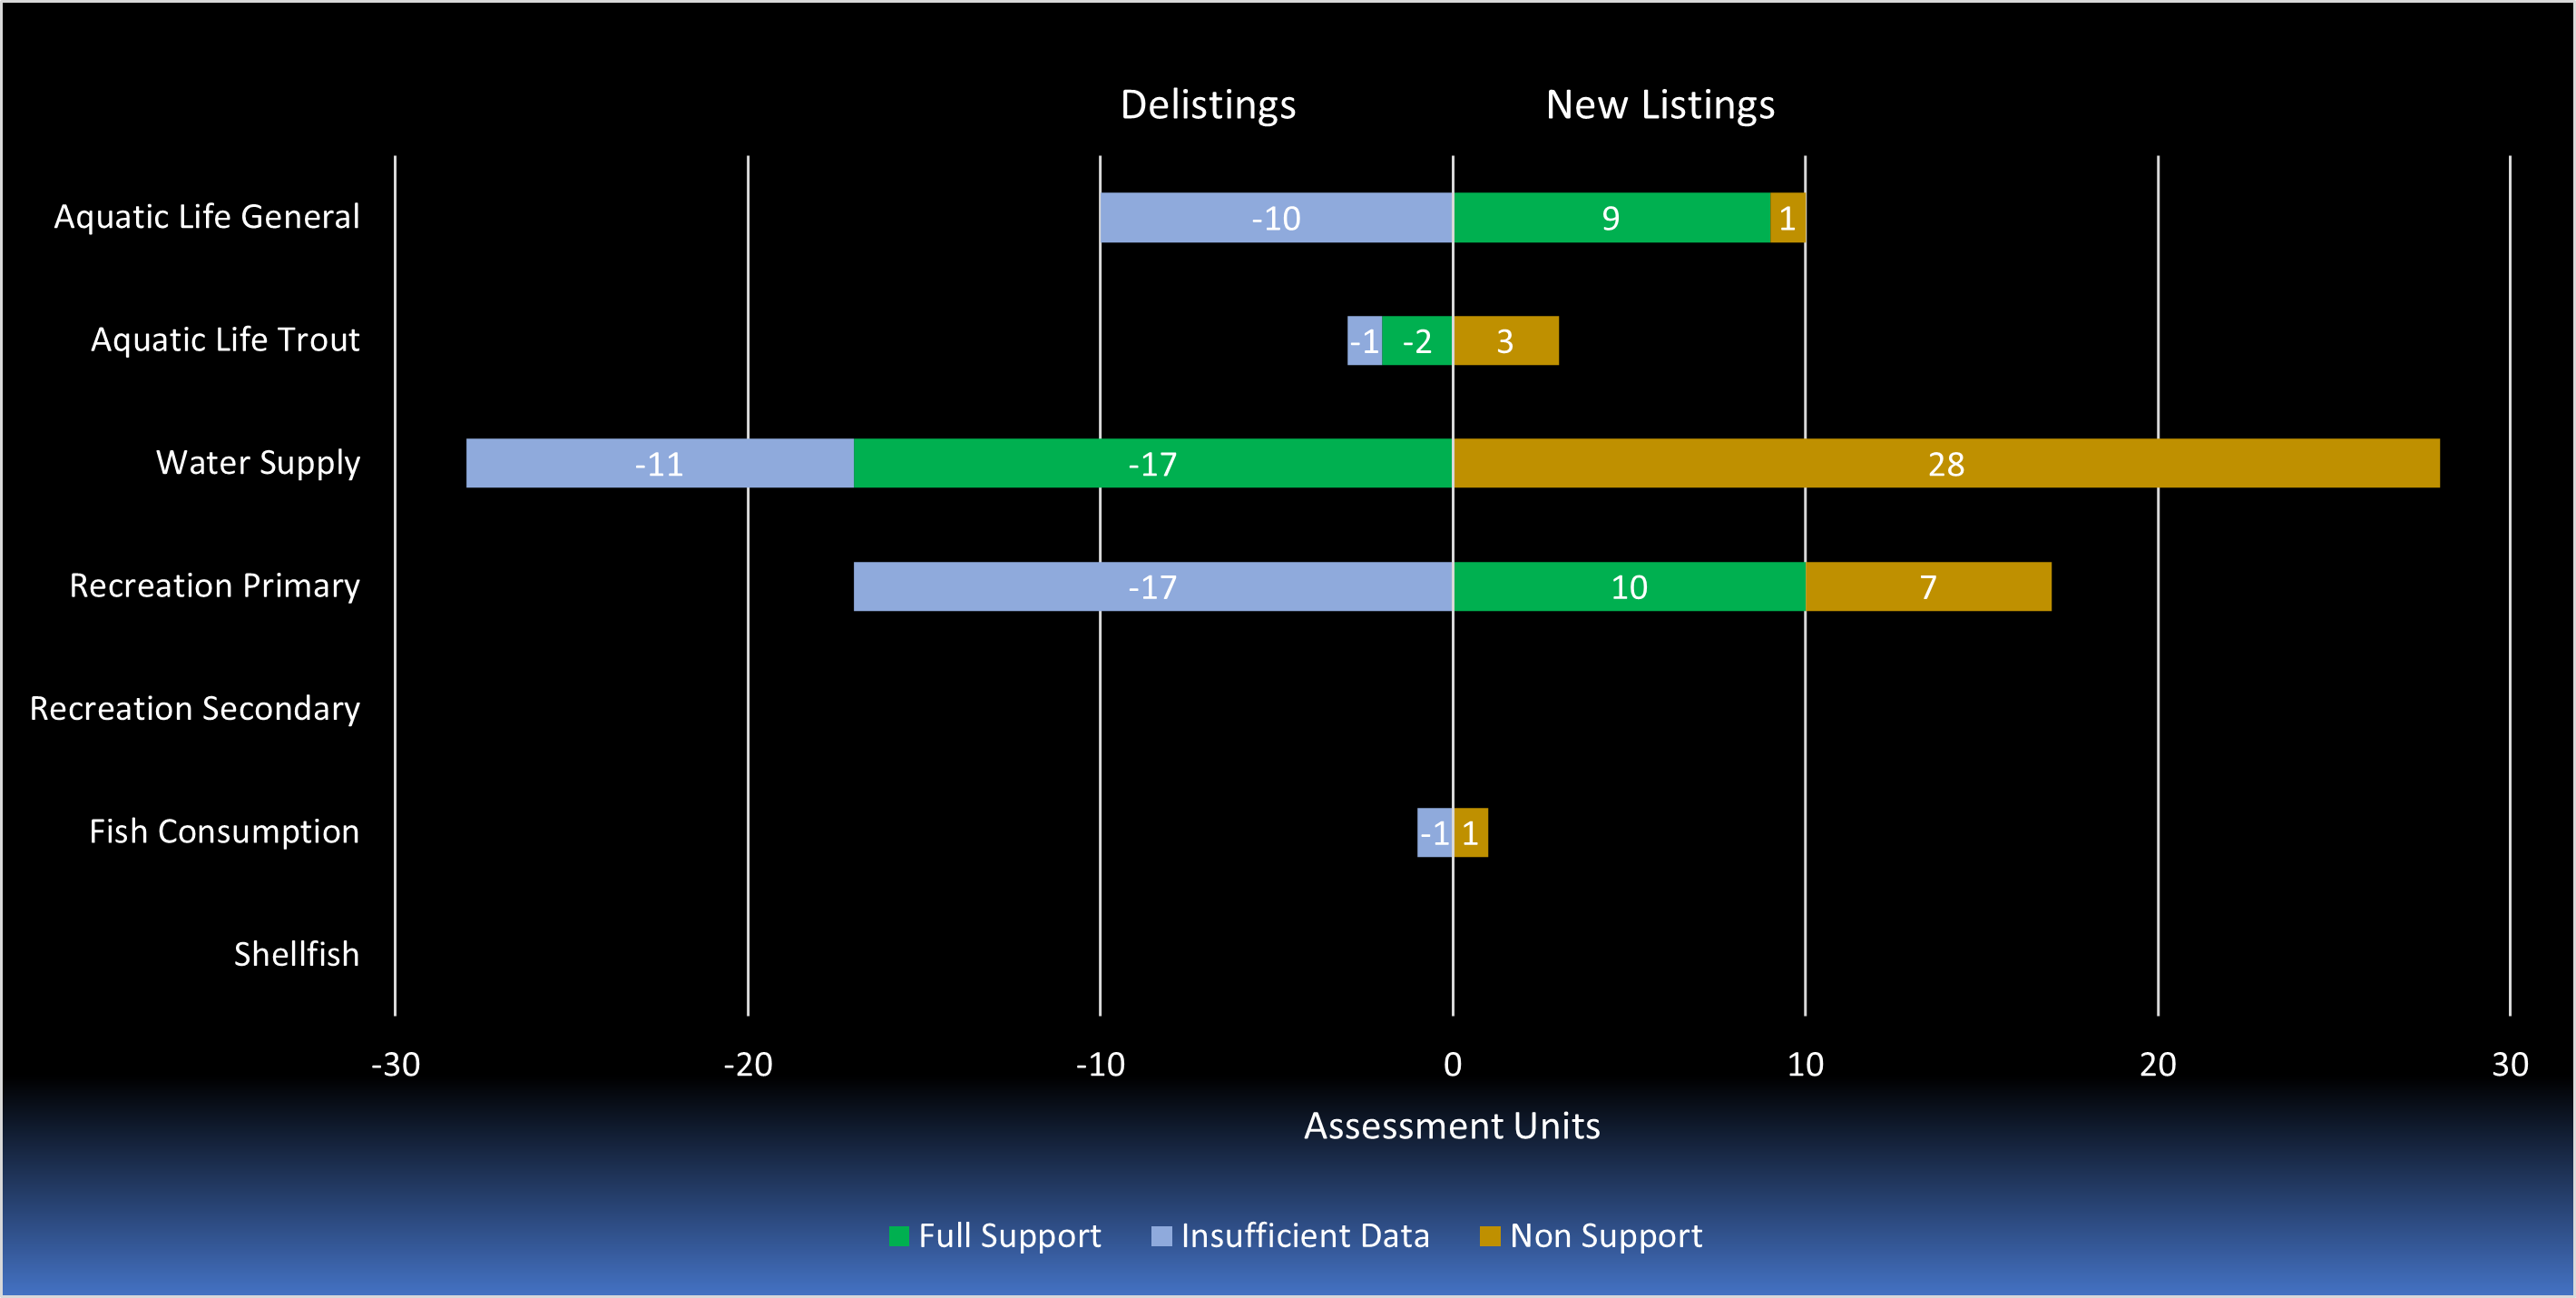
The chart above shows the delistings and new listings for each designated use. For example between 2020 and 2022, Aquatic Life General had 10 less “Insufficient Data” AU listings and an additional nine “Full Support” AU listings and one additional “Non Support” AU listings. The number of delistings and new listings usually are the same amount.
Parameters – Water Quality
Top 10 Pollutants in the Northeast Region
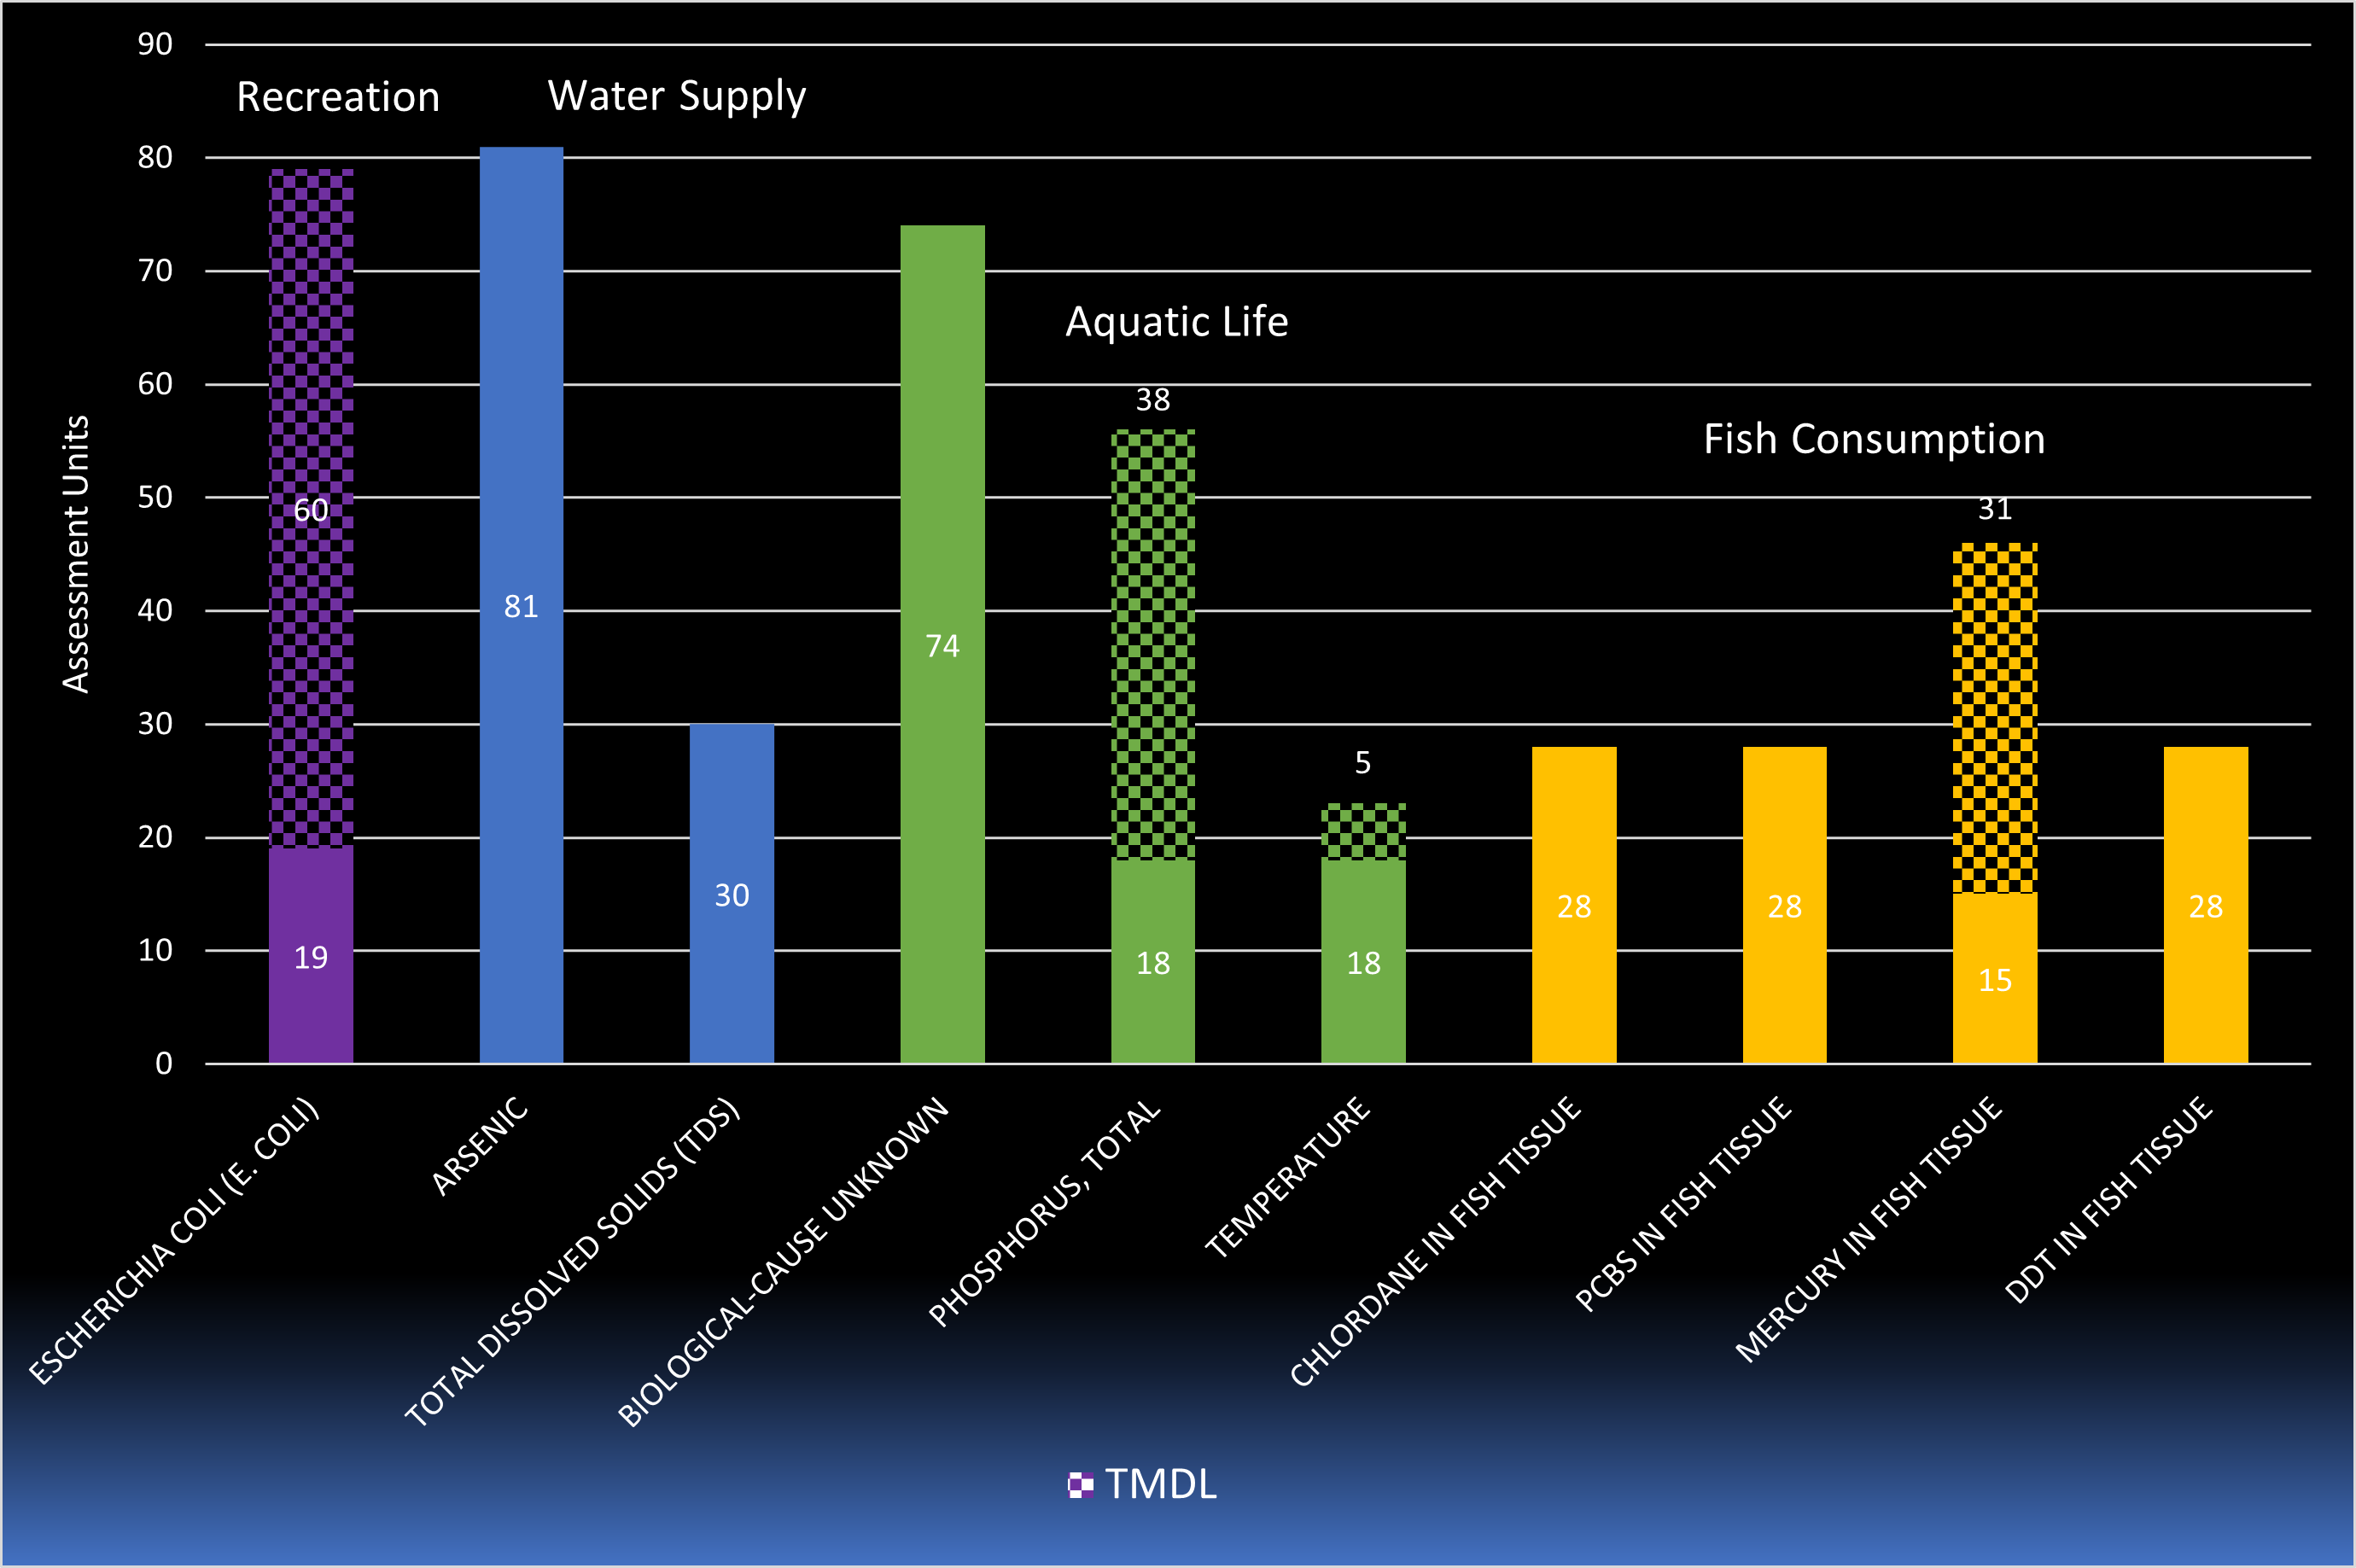
The Top 10 pollutants in the Northeast Water Regions are similar to the Statewide results with a few notable differences outlined below. Seven parameters are present in the Northeast Water Region that mirrored our statewide top 10 pollutant findings. These repeat pollutants (E. coli, arsenic, biological cause unknown, total phosphorus, temperature, PCBs, and Mercury) and the magnitude of their effect on the associated designated uses are equivalent in comparing results from both spatial extents. Three parameters that displaced top 10 statewide parameters (pH, dissolved oxygen, and fecal coliform) included total dissolved solids (TDS), chlordane in fish tissue, DDT in fish tissue in the Northeast Water Region.
E. coli remained the top concern for primary recreation designated use again in Northeast Water Region. Arsenic was diagnosed with the highest parameter for water supply designated use in comparison to TDS presence. The finding of TDS in the regional top 10 is not surprising based on the significant amount of roads and urban land use in the northeast. The winter deicing of these surfaces leads to water quality impairment. This is discussed in detail on the State Concerns/Recommendations report tab above. Biological cause unknown, total phosphorus, and temperature remain concerns in the regional figure for aquatic life designated use. Dissolved oxygen and pH are not highlighted regionally here as in the statewide results. Mercury and PCBs in fish tissue repeat from our statewide results in the Northeast Water Region results. Additionally, Chlordane and DDT are present as regional legacy pollutants. With the absence of shellfish harvestable waters in the Northeast Water Region, this statewide concern is not present in the figure above.
The predominance of fish tissue sampling in the Northeast Water Region found elevated levels of more contaminants that restrict the consumption of fish. Legacy discharge and the longevity of PCBs, Chlordane, and DDT in the environment are contributing factors to the impaired waters list in the NJ’s northeast.
The bacterial indicator, fecal coliform, for shellfish harvesting assessments does not apply in the Northeast Water Region.
Go to the link below to view the results as an interactive map. There are interactive maps for each designated use that present the designated use results along with each associated parameter result at the AU level and the stations within the AUs. Search for your results by your current location, address, municipality, or AU name.
Impaired waterbodies that have water quality parameters not attaining their criteria are listed on the 303(d) List and Sublist 4. The 303(d) List represents AUs that are not meeting their use caused by a pollutant that requires a TMDL. Sublist 4 are AUs that are not meeting their use caused by a pollutant which is addressed by a TMDL or other enforceable action that is expected to result in full support in the future. Biological impairments are a direct indicator of the health of a biological community although causes are unknown. The DEP is developing strategies to address these impairments.
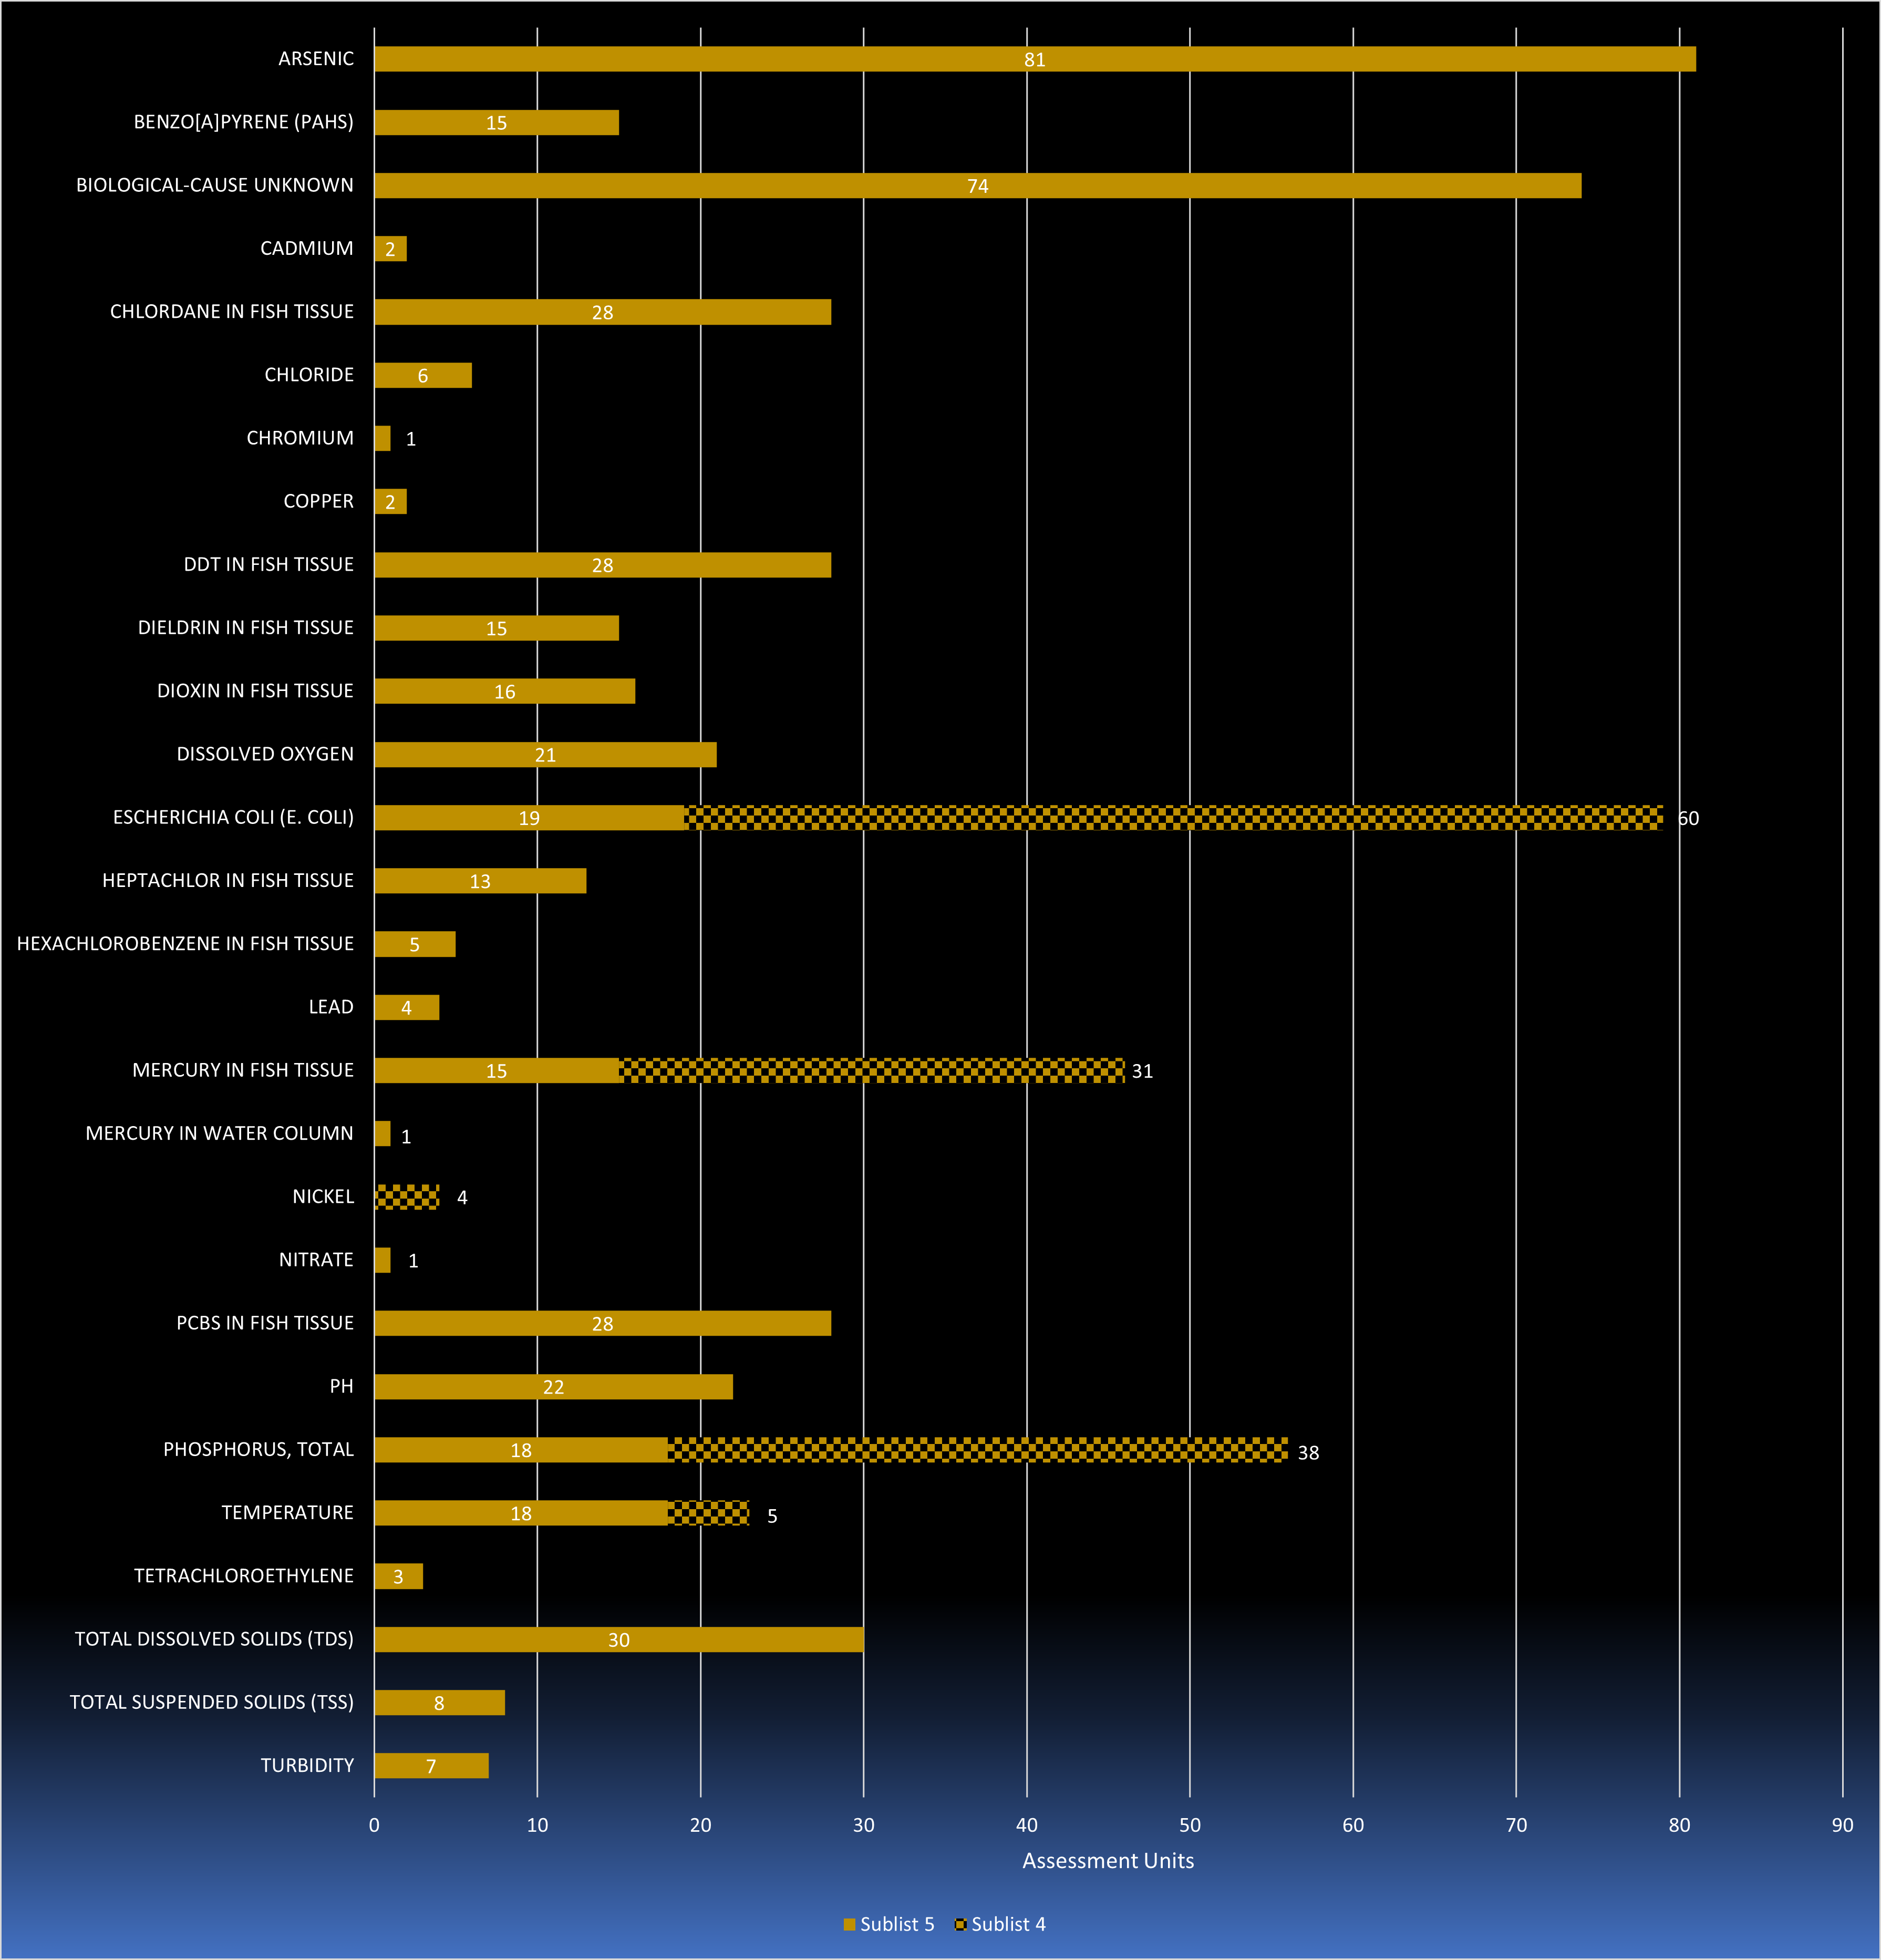
Every cycle there are changes to the Sublists including the 303(d) List and Sublist 4. All new listings are based on the latest data collected, while delistings may be based on new data, TMDLs or other enforceable action moving a parameter from the 303(d) to Sublist 4, or original listing was not correct because of an administrative error.
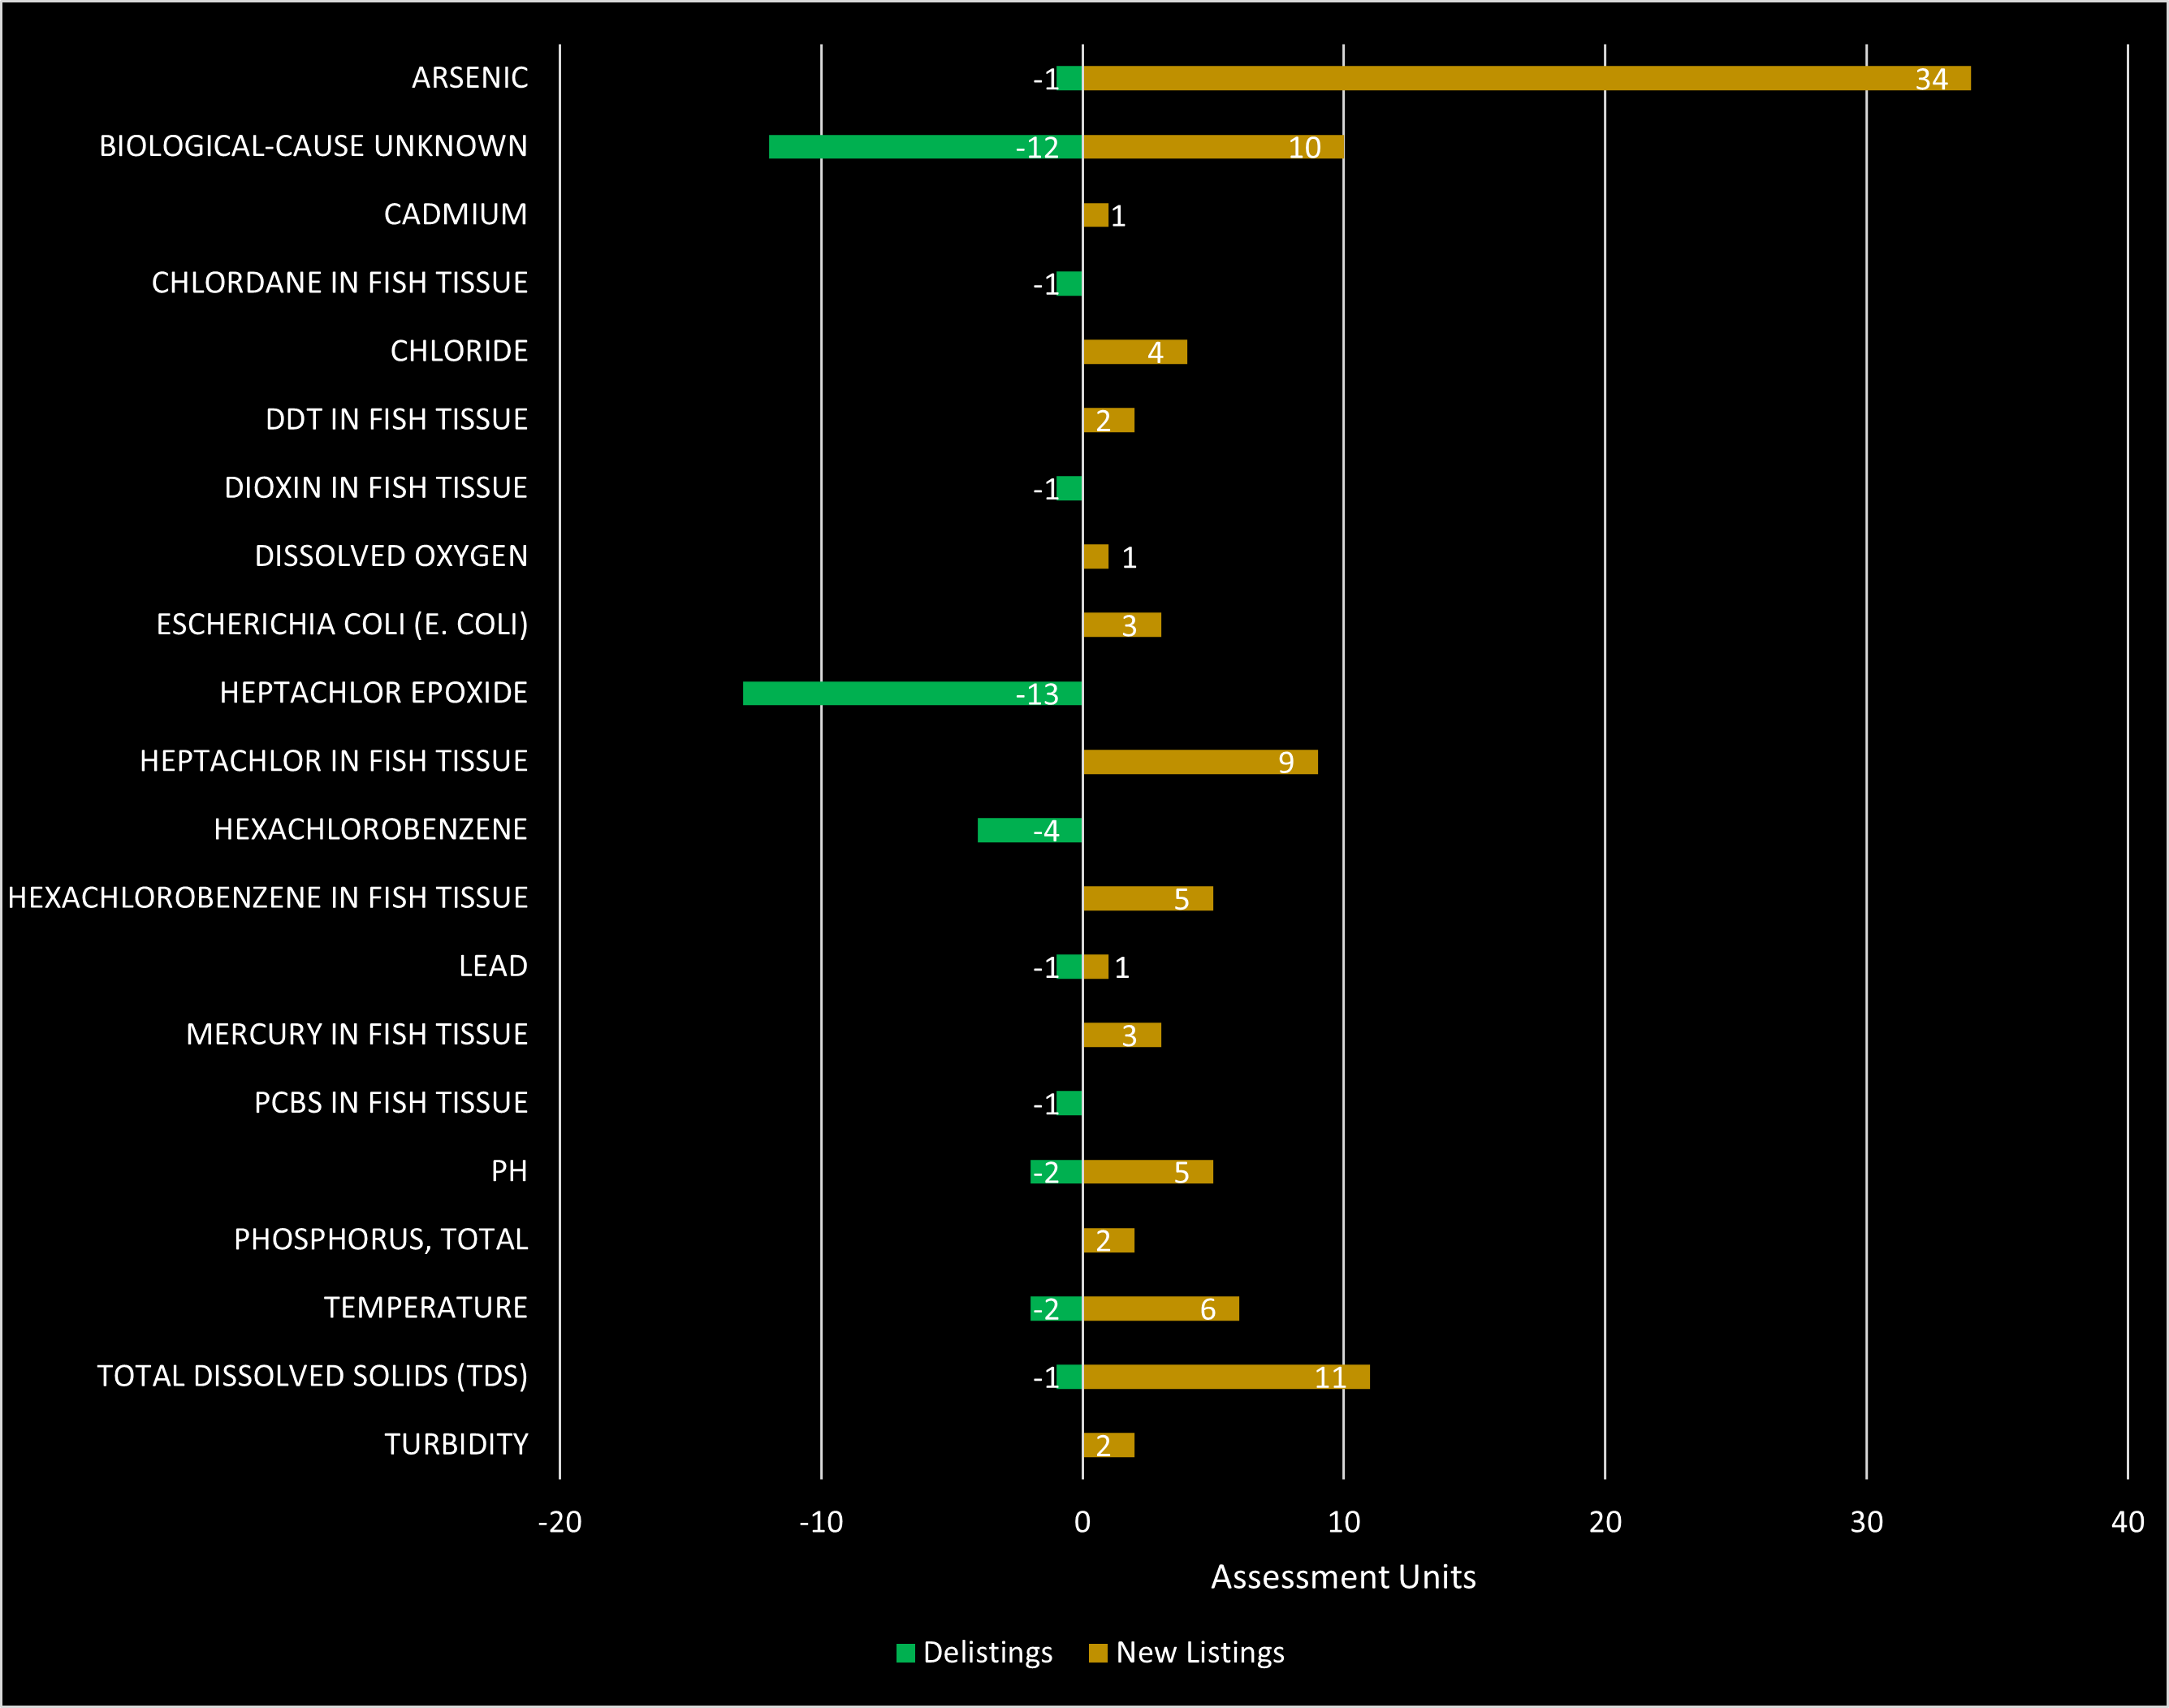
Reason For Delisting from 303(d) List
| Parameters | New Data | Original Listing Incorrect |
|---|---|---|
| ARSENIC | 1 | |
| BIOLOGICAL-CAUSE UNKNOWN | 7 | 5 |
| CHLORDANE IN FISH TISSUE | 1 | |
| DIOXIN IN FISH TISSUE | 1 | |
| HEPTACHLOR EPOXIDE | 13 | |
| HEXACHLOROBENZENE | 4 | |
| LEAD | 1 | |
| PCBS IN FISH TISSUE | 1 | |
| PH | 1 | 1 |
| TEMPERATURE | 2 | |
| TOTAL DISSOLVED SOLIDS (TDS) | 1 | |
| TOTAL | 10 | 29 |
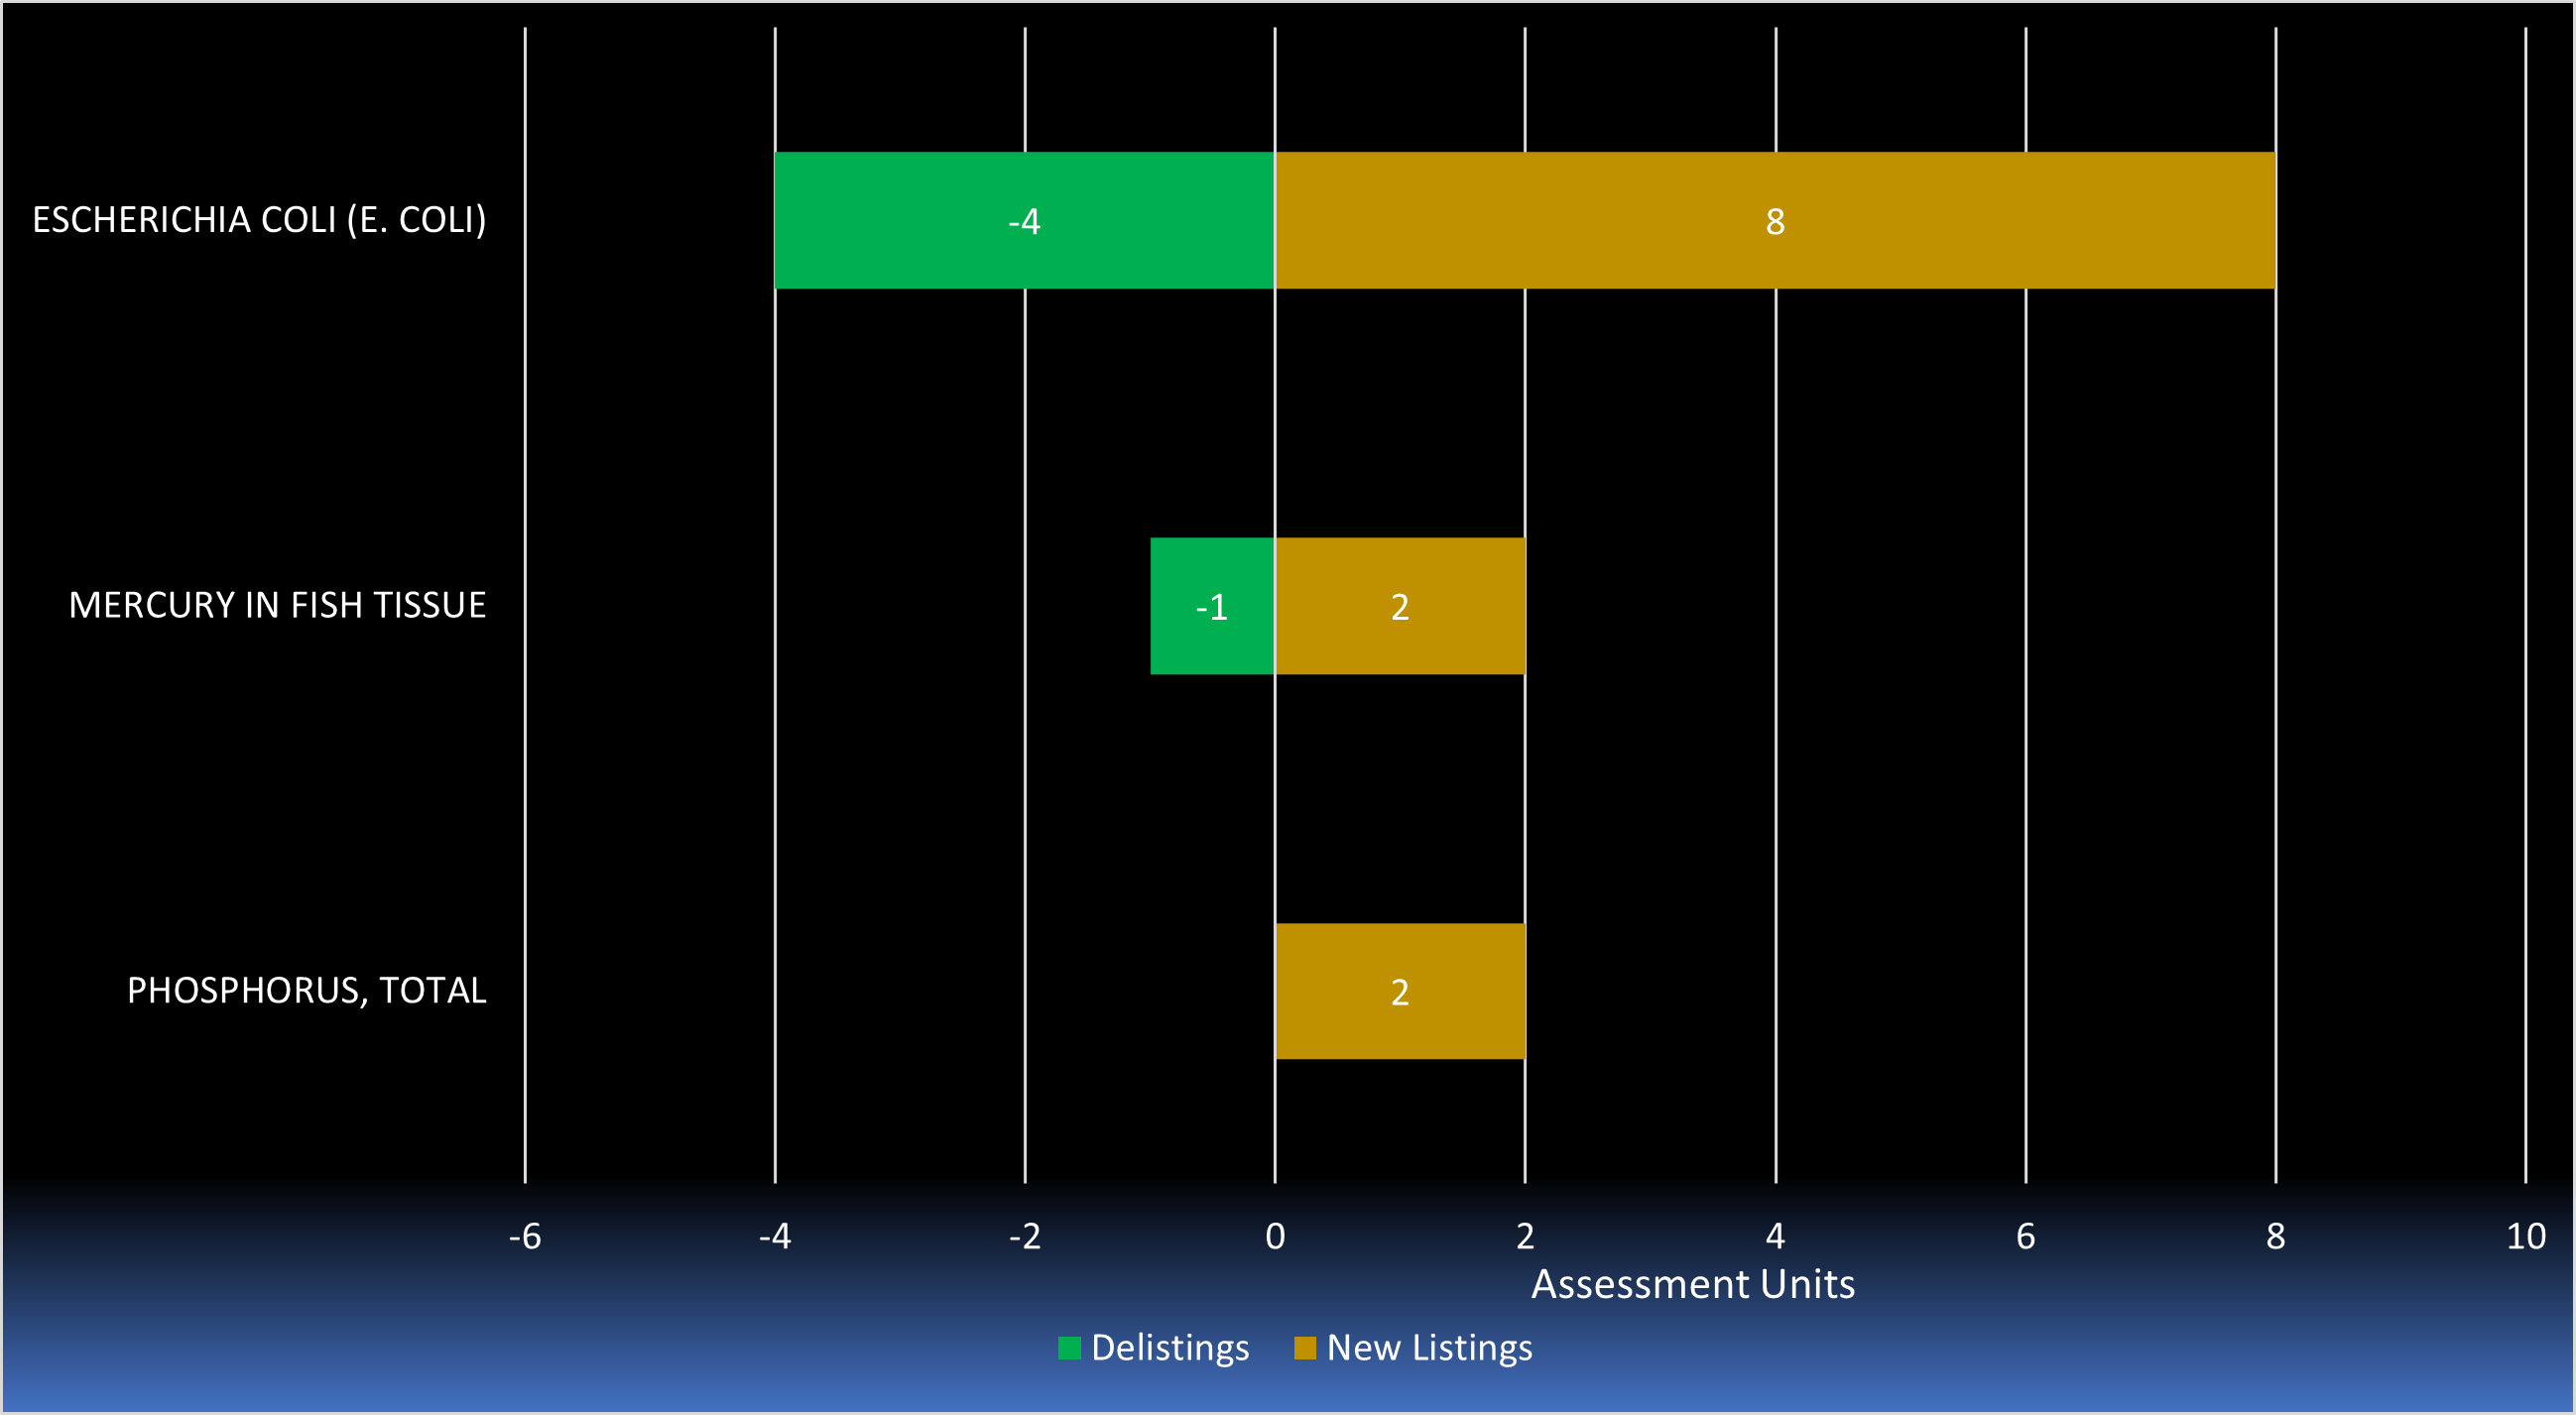
Reason For Delisting From Sublist 4
| Parameters | New Data |
|---|---|
| ESCHERICHIA COLI (E. COLI) | 4 |
| MERCURY IN FISH TISSUE | 1 |
| TOTAL | 5 |
Chemical Trends
| Northeast | Total Nitrogen | Nitrate | Total Phosphorus |
|---|---|---|---|
| Hackensack River at Rivervale | ▼ | ▼ | — |
| Whippany River near Pine Brook | ▼ | — | ▼ |
| Passaic River at Two Bridges | ▼ | ▲ | ▼ |
| Ramapo River near Mahwah | — | ▲ | — |
| Passaic River at Little Falls | ▼ | ▲ | ▼ |
| Saddle River at Lodi | — | ▲ | ▼ |
Recently, the USGS and NJDEP completed new robust statistical trend analysis demonstrating water quality trends in the state over a much longer time period than previous trend reports. Both reports cover over a 30-year period with data from 28 physical/chemical monitoring sites distributed throughout the state. The latest report published by NJDEP in 2020 covers a 35-year period between 1981 to 2016.
Northeast Water Region nutrient trends show overall improving or stable conditions for total nitrogen and total phosphorus. Nitrate shows overall upward trend results. Watersheds with significant NJPDES discharges to surface waters such as Passaic, Ramapo, and Saddle Rivers would be expected to show higher levels of nitrate due to effluent inputs from major wastewater treatment plants.
Why?
Since the 1980s, wastewater dischargers have been regionalized and upgraded to secondary treatment, New Jersey’s Pollution Discharge Elimination System (NJPDES) permits have reduced nutrient discharge concentrations, NJDEP nonpoint source pollution programs have been implemented, and local stewardship activities have been targeting nonpoint source pollution which have all contributed to the reduction of total phosphorus and total nitrogen in our waterbodies.Increases of nitrate are attributed to ammonia reduction measures implemented at wastewater treatment plants that oxidize ammonia to form nitrate, inadvertently resulting in increased nitrate concentrations. Ammonia is much more detrimental to the environment than nitrate because of its uptake of oxygen and its toxicity to aquatic life.
Changes in land use can be a factor in the stabilization of nutrients; however, the Northeast Regions is well developed as an urban area. With minimal agricultural lands, nutrient runoff from agricultural practices is very small. Inputs of TN and TP from less intensive domestic activities such as fertilizing of lawns are less significant.
Metal Trends
The most significant development in the Northeast Water Region is the dramatic decrease of metal and ammonia levels resulting in a near 65% decrease in the number of impairments on the 303(d) List since 1998. In 1998, there were 208 impaired listings for toxicants. In 2022, only 75 toxicants remain on the 303(d) List. A majority of the 2022 303(d) listed toxicants are based on modeling results for the NY/NJ Harbor completed in the early 2000’s.
This remarkable improvement is the result of
- Issuing discharge limits for point source dischargers (both water and air)
- Remediation of contaminated sites
- Manufacturers closing or moving out of the region
Arsenic is not incorporated into the numbers above and this trend assessment. The frequency of arsenic impairments have increased over time due to improved detection levels for the lab analysis.
Statewide metals and toxicants discharging into waterbodies have drastically been reduced, however, legacy issues still impact some areas of the state where metals remain in the sediment. During storms and high flow, these sediments can become resuspended in the water column and elevated metal levels can be found exceeding their criteria.
Declines of ammonia levels are attributed to improved wastewater treatment processes that have resulted in reduced discharge levels.
Metal and Toxicant Listing Comparison in the Northeast Water Region
| Metals & Toxics | 1998 303(d) Listings | 2022 303(d) Listings |
|---|---|---|
| Benzoapyrene (PAH) | 0 | 14 |
| Beryllium | 8 | 0 |
| Cadmium | 16 | 2 |
| Chromium | 24 | 1 |
| Copper | 31 | 2 |
| Dieldrin | 0 | 15 |
| Heptoachlor | 0 | 13 |
| Hexachlorobenzene | 0 | 4 |
| Lead | 39 | 4 |
| Mercury | 35 | 13 |
| Nickel | 12 | 4 |
| Selenium | 3 | 0 |
| Silver | 7 | 0 |
| Thallium | 4 | 0 |
| Zinc | 13 | 0 |
| Ammonia | 6 | 0 |
| Tetrachloroethylene (PCE) | 3 | 3 |
| Trichloroethylene (TCE) | 3 | 0 |
| TOTAL | 208 | 75 |
Biological Trends
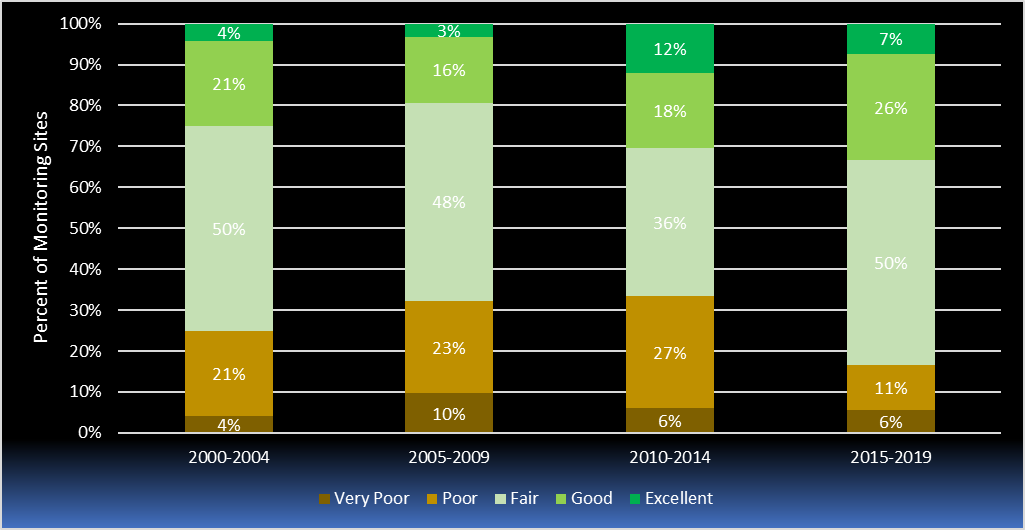
Overall, both fish and macroinvertebrate trend assessments point to slightly improving conditions in the Northeast Water Region. Macroinvertebrate communities show overall degraded conditions with poor sites showing improvement to fair conditions. Fish communities show overall fair conditions with poor sites showing improvement to fair conditions as well. The tables below show biological monitoring in the freshwater portions of the region only.
- Vast areas of the region are predominantly urbanized or agricultural with degraded riparian zones that reflect impacted biological conditions. In many headwaters, especially in the Highlands, biological conditions are healthy.
- Fish communities show mixed trend results over time with a high percentage of Fair conditions. Fair conditions are fully supporting aquatic life designated use.
- Macroinvertebrate monitoring in the NY/NJ Harbor between 1993 to 2013 show improving conditions, but impairments remain in the Newark Bay and its tributaries.
Northeast Region Macroinvertebrate Trend
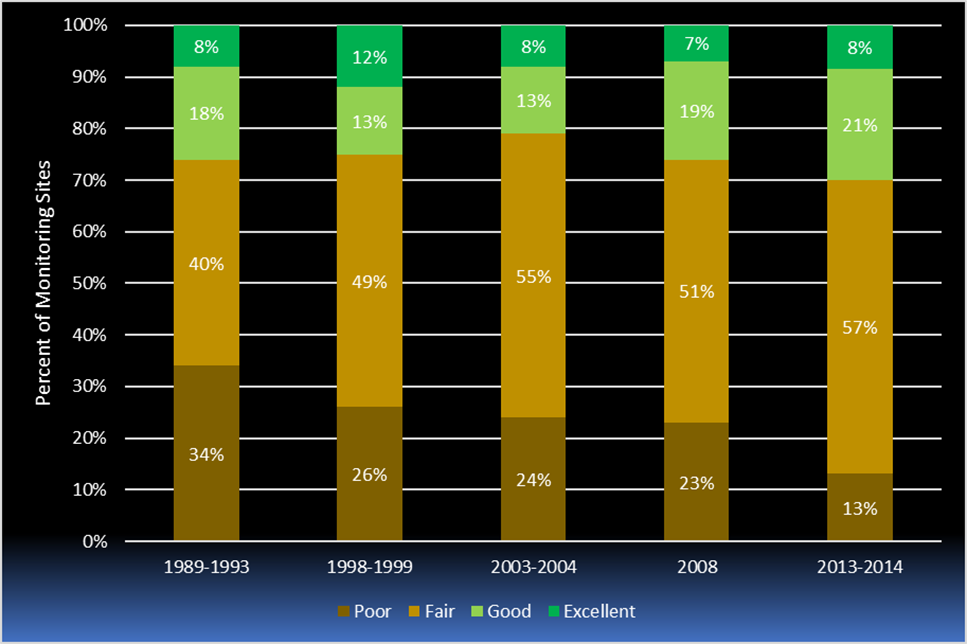
Macroinvertebrate trends based on data from the DEP’s Ambient Macroinvertebrate Network (AMNET)
Northeast Region Fish Community Trend
Fish trends based on data from the DEP’s Fish Index of Biotic Integrity Network (FIBI)
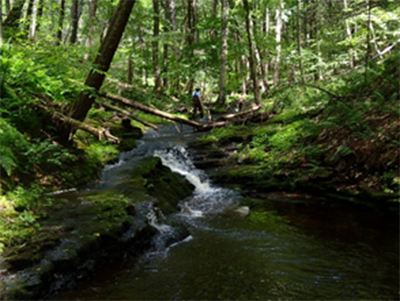
Healthy riparian zone
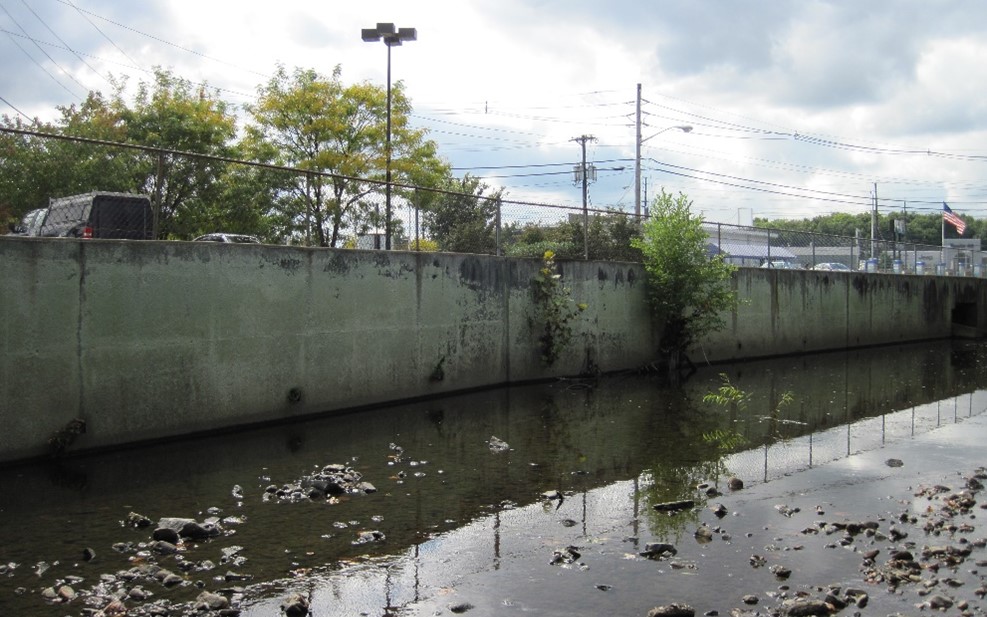
Highly degraded riparian zone
Why?
Since colonial times, the Northeast Water Region has been the most densely populated area in the state with a history of substantial industrial use. During the last few decades, urbanization has increased. The changes in the region have shown increases in development density and some loss in wetlands and forested areas. This has resulted in stream buffer and riparian zones being further degraded. There are areas in the headwaters and northwestern areas of the region that are heavily forested and a major drinking water source for the state.
An analysis of biological trends based on land use shows that impervious surface is the most predictive and reliable indicator for biological integrity and agrees with numerous other studies that have been published. We looked at agricultural lands, urban development and impervious surface at the assessment unit level and in riparian zones, defined as 300-ft buffers around the streams.
Where impervious surface exceeds 10%, the aquatic ecosystem displays extensive degradation with 90% of the biological communities impaired. However, this occurred only where riparian zones exceeded 10% impervious surface and did not show a clear response at the assessment unit level. Riparian zones show they are very sensitive to disturbances and that impervious surface is a much better predictor than agricultural or urban development land use.
Development in the riparian zone degrades the benefits from a healthy ecosystem by intensifying storm water flow, destabilizes streambanks, increases levels of sedimentation and other nonpoint pollutants, rises water temperatures, damages stream habitat, reduces infiltration into the soil, as well as increases the frequency and intensity of flooding and low stream flows.