DGS02-5 Selected U.S. Geological Survey and N.J. Department of Environmental Protection Monitoring Networks
Abstract
Digital Geodata Series DGS02-5 is a collection of GIS shape files that show the locations of selected surface- and ground-water monitoring networks in New Jersey. The networks are maintained and operated individually or jointly by the U.S. Geological Survey (USGS) and the N.J. Department of Environmental Protection (NJDEP). This product does not provide any actual surface-water or ground-water flow or quality data. The user must contact either the USGS or NJDEP to obtain observed values.
The USGS maintains a more thorough description of the gages on its website (http://nj.usgs.gov/).
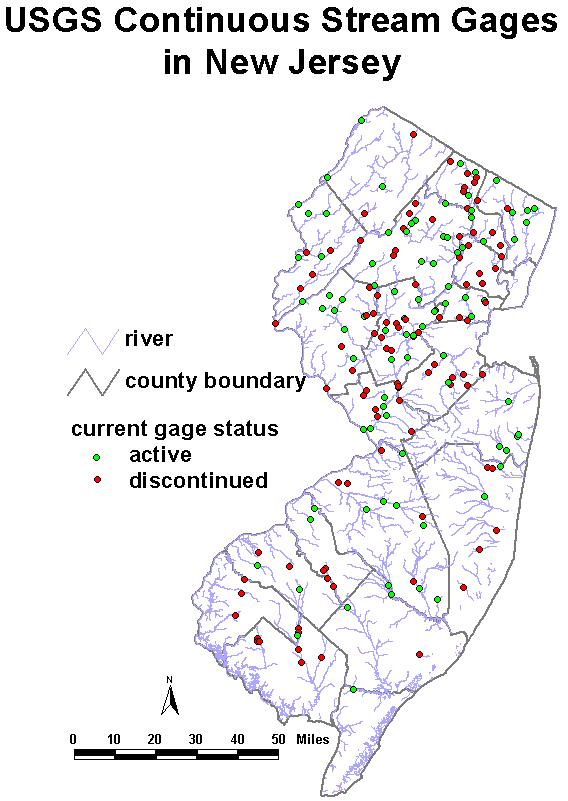
USGS continuous stream-flow gages
The US Geological Survey maintains a network of gages across New Jersey that continuously monitor stream flows. Funding for these gages comes from both Federal and State monies. These data are transmitted to the USGS and made available over the Internet (http://nj.usgs.gov/). This coverage provides the locations of these gages. As project needs and funding levels change, gages may be added or deactivated, and deactivated sites may be reactivated. The available shape file shows active and inactive continuous stream gages as of spring 2002.
See the US Geological Survey’s web site (http://nj.usgs.gov/) for streamflow data. Contact the USGS for more information on these gages.

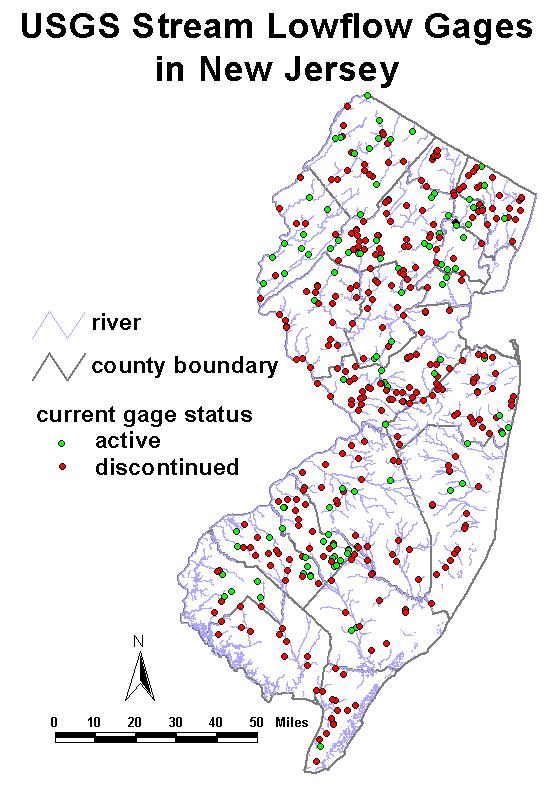
USGS stream low flow gages
The US Geological Survey monitors low streamflows at a number of sites across New Jersey. Funding for these gages comes from both Federal and State monies. These measurements are made primarily for project work so sites become active for a few years and then are discontinued.
The data measured at the active sites are published annually as part of the USGS’ series of annual water-data reports.. Contact the USGS for more information on these gages.
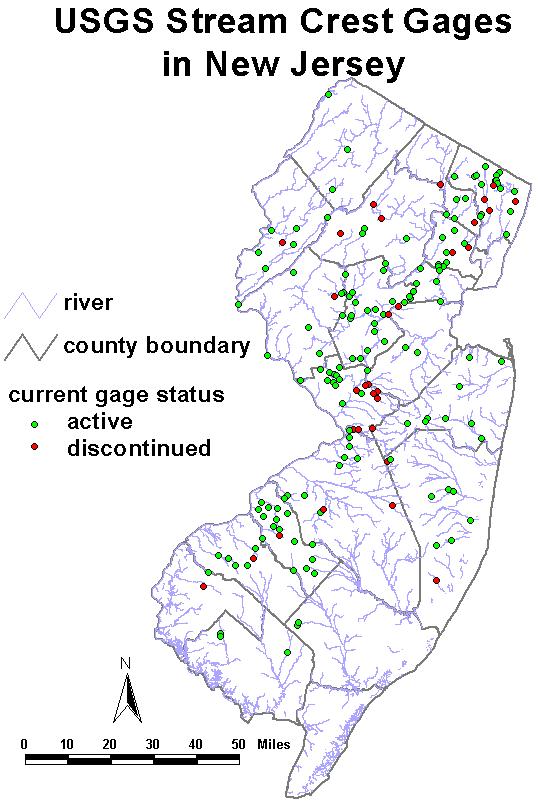
USGS stream crest gages
The US Geological Survey maintains a network of gages across New Jersey that are periodically monitored to determine stream crest. Funding for these gages comes from both Federal and State monies. These gages record only the maximum stream crest between visits. This coverage provides the locations of these gages. As project needs and funding levels change, gages may be added or deactivated, and deactivated sites may be reactivated. The available shape file shows active and inactive continuous stream crest gages as of spring 2002.
The data measured at the active sites are published annually as part of the USGS’ series of annual water-data reports. Contact the USGS for more information on these gages.

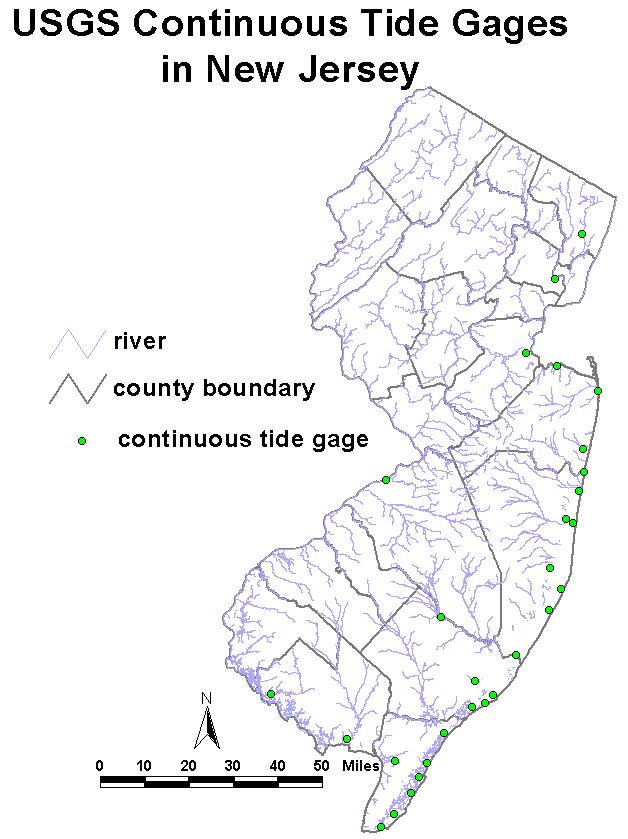
USGS continuous tide gages
The US Geological Survey maintains a network of gages across New Jersey that continuously measure tidal levels. Funding for these gages comes from both Federal and State monies. These data are transmitted to the USGS and made available over the Internet (http://nj.usgs.gov/). This coverage provides the locations of these gages. As project needs and funding levels change, gages may be added or deactivated, and deactivated gages may be reactivated. The available shape file shows active and inactive continuous tide gages as of spring 2002.
See the US Geological Survey’s web site (http://nj.usgs.gov/) for tide data. Contact the USGS for more information on these gages.

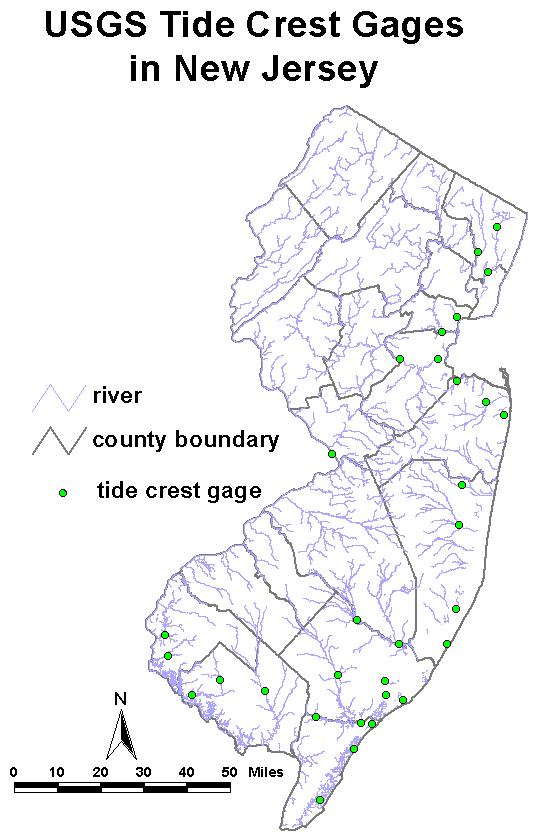
USGS tidal crest-stage gages
The US Geological Survey maintains a network of gages across New Jersey that are periodically monitored to determine tidal crest-stage. Funding for these gages comes from both Federal and State monies. These gages record only the maximum tide crest between visits. This coverage provides the locations of these gages. As project needs and funding levels change, gages may be added or deactivated, and deactivated sites may be reactivated. The available shape file shows active and inactive tidal crest-stage gages as of spring 2002.
The data measured at the active sites are published annually as part of the USGS’ series of annual water-data reports.. Contact the USGS for more information on these gages.

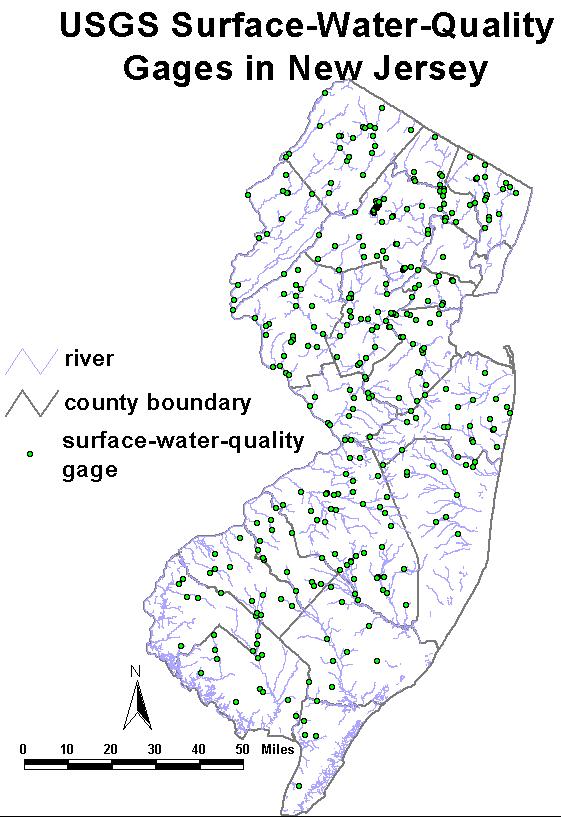
USGS surface-water-quality gages
The US Geological Survey maintains a network of gages across New Jersey at which surface water quality is measured. Funding for these gages comes from both Federal and State monies. This coverage provides the locations of selected current and historical locations. As project needs and funding levels change, gages may be added or deactivated, and deactivated sites may be reactivated. The available shape file shows active and inactive gages as of spring 2002.
The data measured at the active sites are published annually as part of the USGS’ series of annual water-data reports. Contact the USGS for more information on these gages.

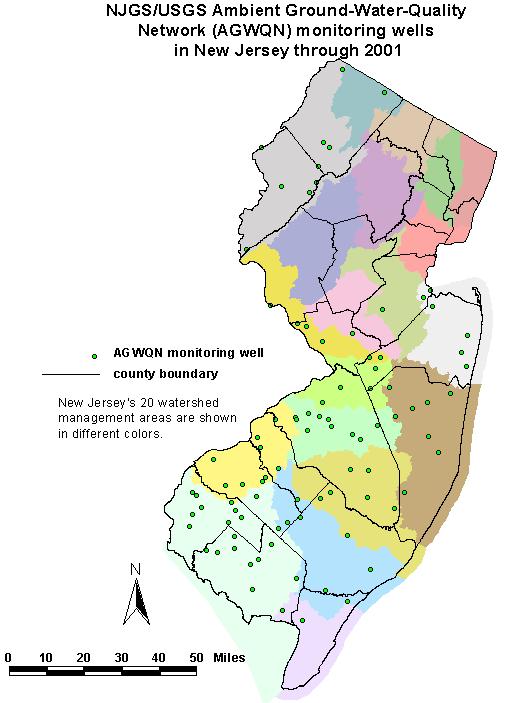
NJGS/USGS Ambient Ground-Water-Quality Network (AGWQN)
This data set is a GIS point coverage of the NJGS/USGS Ambient Ground-Water-Quality Network (AGWQN) monitoring wells in New Jersey. This network is maintained jointly by the New Jersey Geological Survey, NJDEP and the United States Geological Survey. The AGWQN is designed to monitor the quality of ground water at or near the water table throughout the State. Shallow ground water is generally the first and most significantly affected part of the ground-water system, and the quality of this water is directly related to human activities at the land surface.
The AGWQN is a long-term monitoring network designed to assess the status of shallow ground-water quality. This is accomplished by 1) examining the concentrations of various constituents used as environmental indicators, 2) assessing water-quality trends by studying data collected on a 5-year cycle, 3) investigating the effects of land use on shallow ground water, 4) identifying impacts from nonpoint sources of contamination, and 5) recognizing from these data emerging or new environmental threats.
The network will consist of 150 shallow ground-water wells throughout New Jersey within three land-use types. Sixty wells are, or will be, located, in agricultural areas, 60 in urban/suburban areas, and 30 in undeveloped areas within New Jersey’s five water regions (WR’s)- Northwest, Northeast, Raritan, Lower Delaware, and Atlantic Coastal. Each year approximately 30 wells will be sampled in one or several of the five regions. The cycle of sampling all 150 wells will be completed every 5 years.
This coverage shows the wells installed in the first three years of the study, or about 60% of the eventual total. This coverage will be updated as additional wells are installed.
The data measured at the active sites are published annually as part of the USGS’ series of annual water-data reports.