
Chemical/Physical Monitoring – Rivers and Streams
The Chemical/Physical Water Monitoring program, initiated in 1976, monitors rivers, and streams using State and Federally approved sample collection and analytical methods. Rivers and streams chemical and physical monitoring generates a large portion of the high quality data used by the DEP’s Bureau of Environmental Analysis, Restoration and Standards for water quality assessments, supports the DEP’s priority of achieving waters that are fishable and swimmable, and provides data used for water quality status and trends results to inform water resource management on a statewide basis. Recent information on surface water quality trends in New Jersey is available in the following two reports:
- Trends in the quality of water in New Jersey streams, water years 1971-2011
- Surface Water Quality – Rivers and Streams: Chemical and Physical Measurements
The federal Clean Water Act section 106 (e) (1) requires states receiving water grants to monitor the quality of their surface water. The design and implementation of the State’s chemical/physical monitoring programs for freshwater rivers, and streams follows U.S. EPA’s National Guidance on Elements of a State Water Monitoring and Assessment Program (March 2003).
Sampling Video
Ambient Surface Water Quality Monitoring Network
The Ambient Surface Water Quality Monitoring Network is New Jersey’s long-term statewide freshwater monitoring program. Initiated in 1976, the network is a cooperative effort between the DEP’s Bureau of Freshwater and Biological Monitoring and USGS’ New Jersey Water Science Center, using both State and Federal funds (with some additional funding and input provided by the New Jersey Water Supply Authority). General network objectives include:
- Continued tracking of status and trends in statewide water quality
- Investigate and determine background water quality
- Obtain water quality data that can be correlated with specific land uses
- Coordinate the collection of water chemistry and biological data at common locations

Network Design:
- Reference/Background stations: Located throughout the state, these 7 stations are sited in undeveloped areas to determine least impacted water quality. This information is used to help gauge the status of water quality at other monitoring locations.
- Land Use Indicator stations: There are 43 land use indicator stations. These stations were selected to represent four distinct land use categories; urban, agricultural, undeveloped and mixed. Data obtained from these stations is used to evaluate water quality differences between these various land use categories
- Watershed Integrator stations: These 23 stations are located at the pour-point or bottom (above the head of tide) of most of New Jersey’s larger watersheds. Data from these stations provides information on water quality for many of New Jersey’s largest river and stream systems.
- There are 50 probabilistic stations, which are re-selected every two years. These stations are selected using a Generalized Random Tessellation Stratified survey design. The purpose of this design is to enable statistically valid estimates of water quality condition for statewide assessments.
Sampling Frequency and Parameters: Sampling for this network is conducted quarterly by both BFBM and USGS staff to obtain data which represents water quality conditions in both warm and cold weather months. Parameters include field parameters which are analyzed on-site (e.g., dissolved oxygen, pH), conventional/nutrient parameters (e.g., phosphorus, total suspended solids), metals parameters (e.g., lead, mercury), pesticides (e.g., atrazine, carbaryl) and sediment parameters (metals, nutrients, and polyaromatic hydrocarbons (PAHs), and polychlorinated biphenyls (PCBs)). See the full list of parameters .
Field and conventional/nutrient samples are measured or collected at all sites during each quarterly site visit. Metals, pesticides, and sediment samples are collected at a reduced frequency. Metals samples are collected twice a year at all background stations and at a subset (22 reselected every two years) of land use indicator and watershed integrator stations. Pesticide samples are collected once a year all background stations and at a subset (22 reselected every two years) of land use indicator and watershed integrator stations. Sediment samples are collected at a subset (~20 per year) of probabilistic stations.
Regional Targeted Water Quality Network
Network Objectives:
In 2014, New Jersey employed a rotating regional approach to integrated water quality assessment required under Sections 303(d) and 305(b) of the federal Clean Water Act. Through this approach, the Bureau of Environmental Analysis, Restoration and Standards conducts a streamlined assessment of statewide water quality along with a more comprehensive, detailed assessment of water quality in one of New Jersey’s five water regions (Atlantic Coastal, Raritan, Lower Delaware, Upper Delaware and Northeast each assessment cycle [every 1-2 years]). This produces a comprehensive assessment of the entire state every ten years and will support development of measures to restore, maintain, and enhance water quality tailored to the unique circumstances of each region. The Regional Targeted Water Quality Network was established in 2014 to support this approach.

Project Design:
During each monitoring cycle (1-2 years), 25 stations are monitored in regions prioritized by the DEP’s Bureau of Environmental Analysis, Restoration and Standards. Sites targeted for monitoring are selected based on a list of prioritization criteria (e.g. historical monitoring data, land use variables). A greater emphasis is placed on waters that currently have no water quality data or ones that are lacking enough data to make assessment decisions.
See the map and the station list for the 25 current monitoring stations as well as information on previously monitored stations.
Sampling Frequency and Parameters:
To achieve a comprehensive dataset, the network monitoring stations are sampled 10 times per year for 1 - 2 years at a time (once a month excluding November and January) for most parameters (metals parameters sampled four times per year). Sampling regions are then rotated resulting in a complete assessment of the entire state every 10 years. Network stations are sampled for a variety of physical and chemical parameters, such as the following.
- Field parameters are analyzed immediately on-site and include dissolved oxygen, temperature, pH, conductivity, and turbidity.
- Conventional/nutrient parameters (e.g., Phosphorus, Total Suspended solids)
- Metals parameters (e.g. Lead, Mercury).
- Full list of sampled parameters
Barnegat Bay Long-Term Ambient Monitoring Program

Project Objectives: In 2013, the Barnegat Bay Long-Term Ambient Monitoring Program was established to monitor changes in water quality over time and to document changes produced through restoration efforts within the watershed. The program is also part of the DEP’s Barnegat Bay Restoration, Enhancement and Protection Strategy. View information about the overall strategy.

Project Design:
As of 2018, monitoring is being conducted at 35 stations within the Barnegat Bay watershed. The Bureau of Freshwater and Biological Monitoring and several partner organizations are responsible for monitoring at 18 freshwater tributary stations. The Bureau of Marine Water Monitoring is responsible for monitoring at 17 bay locations.
Sampling Frequency and Parameters:
Sampling is being conducted at all 35 locations on a monthly basis. Network stations are sampled for a variety of physical and chemical parameters, such as the following.
- Field parameters are analyzed immediately on-site and include dissolved oxygen, temperature, pH, conductivity, and turbidity.
- Conventional/nutrient parameters (e.g., Phosphorus, Total Suspended solids)
- A full list of sampled parameters can be found by clicking the button below.
Continuous Monitoring
Project Objectives:
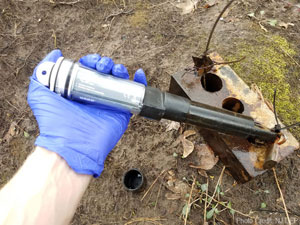
The monthly or quarterly sampling of streams are part of discrete monitoring efforts, in which individual distinct water samples are collected. Continuous monitoring involves using data loggers and sondes with sensors and probes to collect water quality data at pre-determined intervals (often at 15 or 30 minutes) for a specified period. Continuous monitoring plays an important role in freshwater monitoring. In addition to characterizing baseline stream conditions more completely, continuous monitoring gives insight on diurnal (daily) and seasonal fluctuations that may not be seen with monthly or quarterly discrete sampling. Often, sites selected for continuous monitoring have been targeted for a specific parameter of concern, such as diurnal fluctuations in dissolved oxygen. During the day, in warm summer months, dissolved oxygen, may become dangerously low and produce anoxic conditions. Such conditions may not be captured by discrete sampling.

Project Design:
Currently, 40 sites are being targeted for continuous monitoring statewide. Often, sites are selected to assess water quality standards for certain parameters at specific streams. Other sites may have historical discrete data that suggest an exceedance of current surface quality standards in one or more parameters.

Sampling Frequency and Parameters:
Currently, continuous monitoring is used on a limited number of parameters (e.g. temperature, specific conductance, dissolved oxygen). Other parameters such as total suspended solids and copper are still only monitored by discrete sample collection.
Using single or multi-parameter data loggers and sondes, measurements are recorded at a specific time interval (every 15 minutes, 30 minutes) for a designated period, depending on project goals. For example, for diurnal dissolved oxygen monitoring, devices are deployed during the growing season (when photosynthetic activity will likely affect parameters such as dissolved oxygen) anywhere from a few days to several months.
Data from the year 2010 to present is made available to the public at the Division of Water Monitoring, Standards, and Pesticide Control Continuous Data Monitoring website. This data, along with more information on the Division-wide effort for continuous monitoring, can be found by clicking the button below. Data prior to 2010 is available through the National Water Quality Portal as summary statistics (minimum value, maximum value, etc.). Please contact the Bureau for full data sets for this older data.
In addition to its core monitoring networks, the Chemical/Physical Water Monitoring program is involved in projects that are time limited with either more specific goals or serve to fill gaps in current monitoring networks. Click below on any project to learn more.
Water Quality Monitoring Gap and Enhancement Project
Project Objectives: The Water Quality Monitoring Gap and Enhancement Project was established in 2016 as a monitoring effort which focuses on streams, or watersheds that are not currently included in other existing networks. These monitoring locations could be where no previous water quality information was collected or at which previous information is minimal or dated. Other project objectives include:
- Locating sites that can be used to assess background/reference water quality conditions
- Investigating water bodies with suspected water quality issues.
- Monitoring the effectiveness of implemented best management practices.
- Assessing new or updated technologies and methods for future incorporation into routine monitoring work.
- Investigating parameters which have not been sampled previously or in some time.

Project Design:
The current project is comprised of 11 stations. Six of the stations are being sampled 4 times/year to obtain both cold and warm weather water quality data. The other five stations are sites at which continuous monitoring will be conducted. Samples are collected over a 2-year period before moving on to new stations.
Sampling Frequency and Parameters:
Parameters analyzed for the project include:
- Field/analyze immediately parameters (e.g. dissolved oxygen, pH)
- conventional/nutrient parameters (e.g. phosphorus, total suspended solids)
- metals parameters (e.g. lead, mercury)
- continuous monitoring (data loggers or sondes are deployed to record measurements every 15 or 30 minutes to evaluate daily or seasonal fluctuations in certain parameters).
- See the full list of parameters
Field and conventional/nutrient samples are measured or collected at selected sites during each site visit, while metals samples are collected twice a year. Other parameters may be collected on a site/parameters specific frequency. See list of current stations to see where and when specific parameters are being collected.
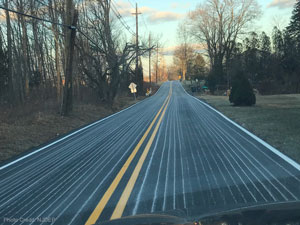
Stream Monitoring for Effects on Water Quality by Road Salt Application
The Bureau of Freshwater and Biological Monitoring is currently involved with a project titled Stream Monitoring for Effects on Water Quality by Road Salt Application. This was a seasonal monitoring project started in 2011, with monitoring that has now expanded into a year-round study.
Project Objectives:
- Develop a specific conductance database that will examine critical, high winter-specific conductance levels, the duration of elevated levels, and comparisons to baseline levels and normal fluctuations throughout the year in a variety of New Jersey’s non-tidal, freshwater streams.
- Obtain insight into when it is best to deploy staff for targeted discrete sampling of total dissolved solids and chloride during periods of snowmelt
- Determine how different road salting operations may be impacting total dissolved solids and chloride levels in water bodies to support potential guidelines on best management procedures.

Project Design:
- There are 14 stream sites currently being monitored for the project.
- Sites were chosen because they exhibited elevated concentrations in water quality parameters associated with road salting, but needed additional data for assessment purposes.
- Full list of monitoring locations
Sampling Frequency and Parameters:
- Data loggers are deployed at each of the sites which collect conductivity and temperature readings every thirty minutes. Six times a year, field parameters, flow measurements, and chloride and total dissolved solids samples are collected as well.
- Field parameters are analyzed immediately on-site and include dissolved oxygen, temperature, pH, conductivity, and turbidity.
- Chloride and total dissolved solids samples are delivered to the New Jersey Department of Health (NJDOH) for analysis.
- Table of all parameters
Stream Flow

Stream flow (also called discharge) can be defined as the volume of water passing a set point in a given period of time.
The drainage area and land uses surrounding a stream can have a significant impact on stream flow. Small mountain streams respond quickly to rain events; rising fast, but then returning to normal flow conditions quickly. Larger streams have a longer lag time due to the large drainage area and tend to rise and fall slowly. The amount of impervious cover (parking lots, houses, etc.) from development can also influence how the flow of a stream responds to rain events.
Stream flow measurements play an important role during periods of flooding when the expected “crests” of streams are closely monitored. However, flow measurements also play a role in assessing water quality issues.
Water samples from a stream can be sent to a lab to determine the concentration of a pollutant (the amount of pollution within a defined volume of water), but when used with a flow measurement the load of a pollutant can be calculated to determine how much of a pollutant is discharged from a stream over a period of time.
These measurements are used to determine daily loads of a specific pollutant and can be used to develop a Total Maximum Daily Load requirement for a stretch of stream with the goal of improving stream water quality. Measuring flow can also provide insight on seasonal trends and how a stream responds to rain events.

Obtaining flow measurements are done by different methods. Many water quality sampling sites on larger streams are co-located with stream gages maintained by the United States Geological Survey, which provide real-time discharge measurements. At sites without a gaging station, the Bureau uses an acoustic Doppler current profiles.
Using the principle of the Doppler effect, a beam measures the change in frequency from sediment in the water flowing by to measure velocity. Typically in wadable streams, a cross section of a stream channel is divided into sub-sections where the area is calculated by the measured width and depth. This is then used to calculate a flow measurement with the given velocity. The velocities from each sub-section are then added up to calculate an overall flow. Flow is typically measured in cubic feet per second.
The Bureau has also developed the capability to collect measurements at non-wadable streams. This involves using a boat mounted acoustic doppler current profiler which takes continuous measurements of water velocity as it is moved across the stream.
To learn more about the procedures used by the Bureau, view the in-depth training course by the United States Geological Survey
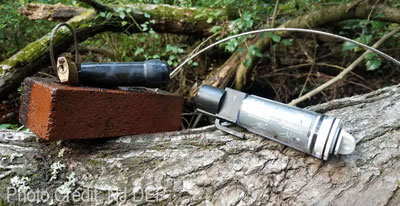
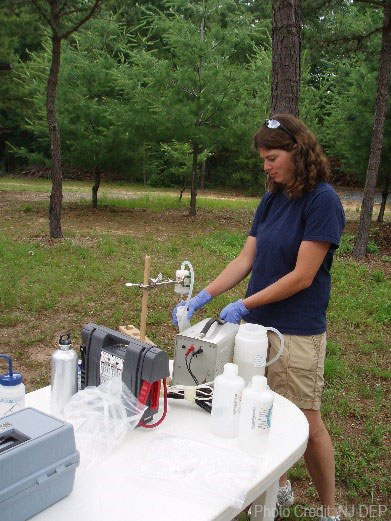
Field Analysis
For every sampling event at a stream, on-site measurements of physical and chemical parameters are taken. Many parameters such as pH and dissolved oxygen need to be measured on site since they are affected by water temperature or other factors. Daily calibrations of meters and multiple measurements help ensure both precision and accuracy of these field readings. Standards (known concentrations) are used to calibrate and perform checks on meters before any sampling event.


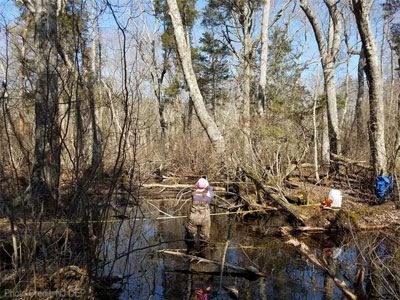
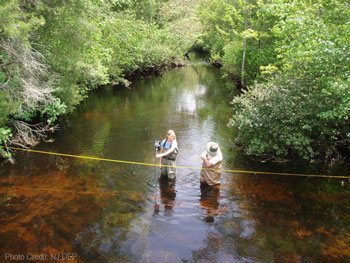
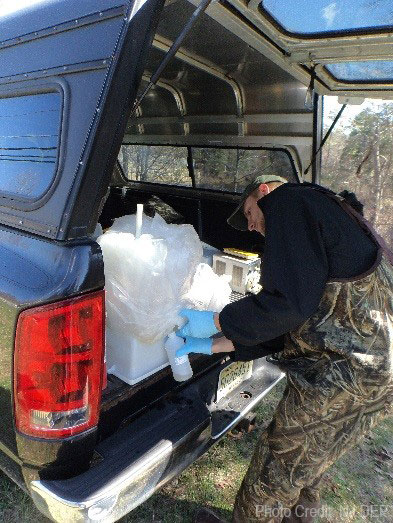
Water Sampling
To properly characterize the chemical and physical parameters of a stream, sample collection is not always as simple as dipping a single bottle in the stream. Rather, a composite sample that incorporates the entire width of a stream as well as the vertical profile may be essential to collecting data representative of the stream’s water quality.
In this process, a stream is divided into sub-sections along a transect and samples are taken in each sub-section. Water is collected in a churn splitter which is used to create subsamples that is representative of the overall stream.
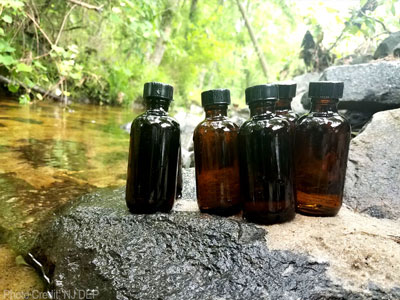
A composite sample of the water collected is created by the stirring of the churn. Two types of samples are collected during processing:
(1) total (non-filtered) samples that contain suspended materials from the water column. Certain constituents can adhere to or be transported by suspended sediment and/or particulates.
(2) dissolved (or filtered) samples, that have had particulates removed. Dissolved components tend to be more biologically available and mobile and thus are more susceptible to uptake by fish and other aquatic organisms.
Diatoms/Periphyton

During the summer months, rocks in a stream bed often develop a slippery brown or green film on their surface. This slime is actually a mixture of algae, cyanobacteria, fungi, diatoms, plant detritus, etc. that live on the submerged substrate of stream beds known as periphyton. Often the dominant algae attached to these rocks and other substrates are diatoms, an abundant group of microscopic algae distinguished by their silica-lined cell walls.

Similar to fish and macroinvertebrates, Diatoms can be used as a bio-indicator for environmental monitoring. They are abundant in streams and quickly respond to changes in water quality. They also vary in tolerance levels of pollutants in streams.
Diatoms have been the focus of sampling for investigating water quality issues. In the past, sampling has been conducted to study nutrient impacts on the health of diatom communities.
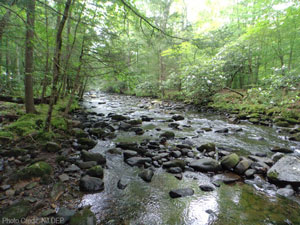
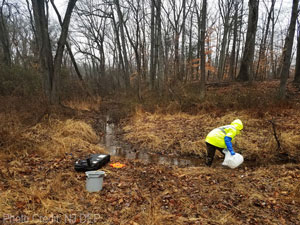
Streambed Sediment

As part of the cooperative Ambient Surface Water Quality Monitoring Network and sometimes for special projects, the Bureau obtains samples of streambed sediment at a subset of sites.
Analyzing streambed sediment for contaminants adds valuable insight into determining the overall water quality of a stream. Fine sediment such as clay and sand accumulate pollutants as they attach to the particles, often producing higher concentrations that may not be shown in water-column samples. Additionally, many contaminants may come from runoff during rain events and, therefore, may not be captured by routine discrete water sampling, especially during normal-flow conditions.

Only the top 1-2 inches of bed material are collected to obtain samples of most recently deposited material. Sediment is passed through a plastic sieve and/or metal sieve (depending on the contaminants being tested) to collect only fine particles of a specified grain size. Sediment is taken from multiple depositional environments within the stream from which a composite sample is produced.
Parameters tested include:
- Metals
- Nutrients
- Polychlorinated biphenyls (PCBs)
- Polyaromatic hydrocarbons (PAHs), chemicals released from the burning of coal, oil, and other substances
- Pesticides
Networks
Duration/Time Period: 1997-2010
Statewide Status sites were replaced in 2010 with HUC14 Assessment sites at the request of the Bureau of Environmental Analysis Restoration and Standards due to adjustments in assessment priorities.
Duration/Time Period: 2010-2015
In 2015, these sites were replaced in the network by probabilistic monitoring sites. The 39 HUC14 sites sampled in 2015 were sampled for an additional year in 2016 as their own project (HUC14 Assessment Monitoring Project).
Duration/Time Period:2016
Duration/Time Period: 2000-2004
Network was renamed Supplemental Ambient Surface Water Monitoring Network in 2005.
Duration/Time Period: 2005-2013
Replaced with Regional Targeted Water Quality Network.
Duration/Time Period: 2013-2015
In 2015, probabilistic monitoring was incorporated into the Ambient Surface Water Quality Monitoring Network to better align statewide monitoring networks.
Projects
Objective: Follow-up monitoring to confirm or supplement legacy data at locations which were assessed as being impaired. The number of stations and sampling frequency varied from year to year, due to the data needs of the Bureau of Environmental Analysis Restoration and Standards. 303d monitoring was conducted in all watershed management areas except WMA16 (no data requested in this area). Sampling included both base flow and elevated flow requirements and parameters included field, nutrients/conventional and metals.