
Underlying Science
Intensifying Storm Surge and Sea-level Rise in New Jersey
- Rutgers University’s Science and Technical Advisory Panel (STAP) Report, released in November of 2019, indicates that:
- Over the last forty years, from 1979-2019, sea-level rose at an average rate of 0.2 in/yr along the New Jersey coast, compared to an average rate of 0.1 in/yr in global mean sea-level.
- New Jersey coastal areas are likely (at least a 66% chance) to experience average sea-level rise rates of 0.2 to 0.5 in/yr over 2010–2050.
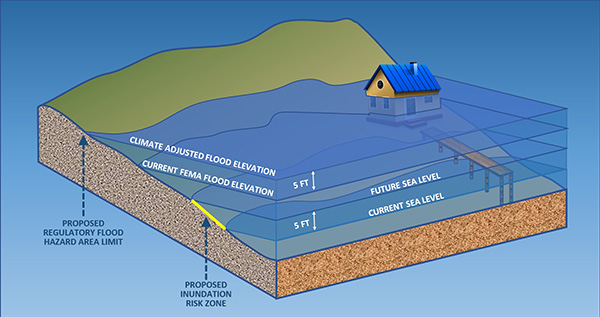
- There is a 50% probability that sea level rise will exceed 3.3 feet and a 17% probability that sea level rise will exceed 5.1 feet in New Jersey by the year 2100.
- Higher temperatures increase the energy in storms and allow the atmosphere to hold more water, which increases the potential for more intense precipitation and flooding:
- By the end of the 21st century, heavy storm events are projected to occur 200 to 500% more often and with more intensity than in the 20th century.
- Major flood events hit New Jersey in 2000, 2004, 2005, 2006, 2007, 2010, 2011, 2012, 2016, and 2021.
- Existing flood standards are based on outdated historical trends that do not account for sea-level rise and attendant storm surge:
- Roads and buildings built today are likely to be unserviceable in 2100.
- Current reliance on incomplete and inaccurate data leads to inadequate risk assessment and substandard design criteria for buildings and infrastructure.
Sea-level rise:
New Jersey Sea-Level Rise above the year 2000 (1991-2009 average) baseline (ft)*
|
2030 |
2050 |
2070 |
2100 |
2150 |
||||||||
|
Emissions |
||||||||||||
| Chance SLR Exceeds |
Low |
Mod. |
High |
Low |
Mod. |
High |
Low |
Mod. |
High |
|||
| Low End | < 95% chance |
0.3 |
0.7 |
0.9 |
1.0 |
1.1 |
1.0 |
1.3 |
1.5 |
1.3 |
2.1 |
2.9 |
| Likely Range | < 83% chance |
0.5 |
0.9 |
1.3 |
1.4 |
1.5 |
1.7 |
2.0 |
2.3 |
2.4 |
3.1 |
3.8 |
| < 50% chance |
0.8 |
1.4 |
1.9 |
2.2 |
2.4 |
2.8 |
3.3 |
3.9 |
4.2 |
5.2 |
6.2 |
|
| < 17% chance |
1.1 |
2.1 |
2.7 |
3.1 |
3.5 |
3.9 |
5.1 |
6.3 |
6.3 |
8.3 |
10.3 |
|
| High End | < 5% chance |
1.3 |
2.6 |
3.2 |
3.8 |
4.4 |
5.0 |
6.9 |
8.8 |
8.0 |
13.8 |
19.6 |
*2010 (2001-2019 average) Observed = 0.2 ft
Get Resilient Environments and Landscapes (REAL) updates.