 Official Site of The State of New Jersey
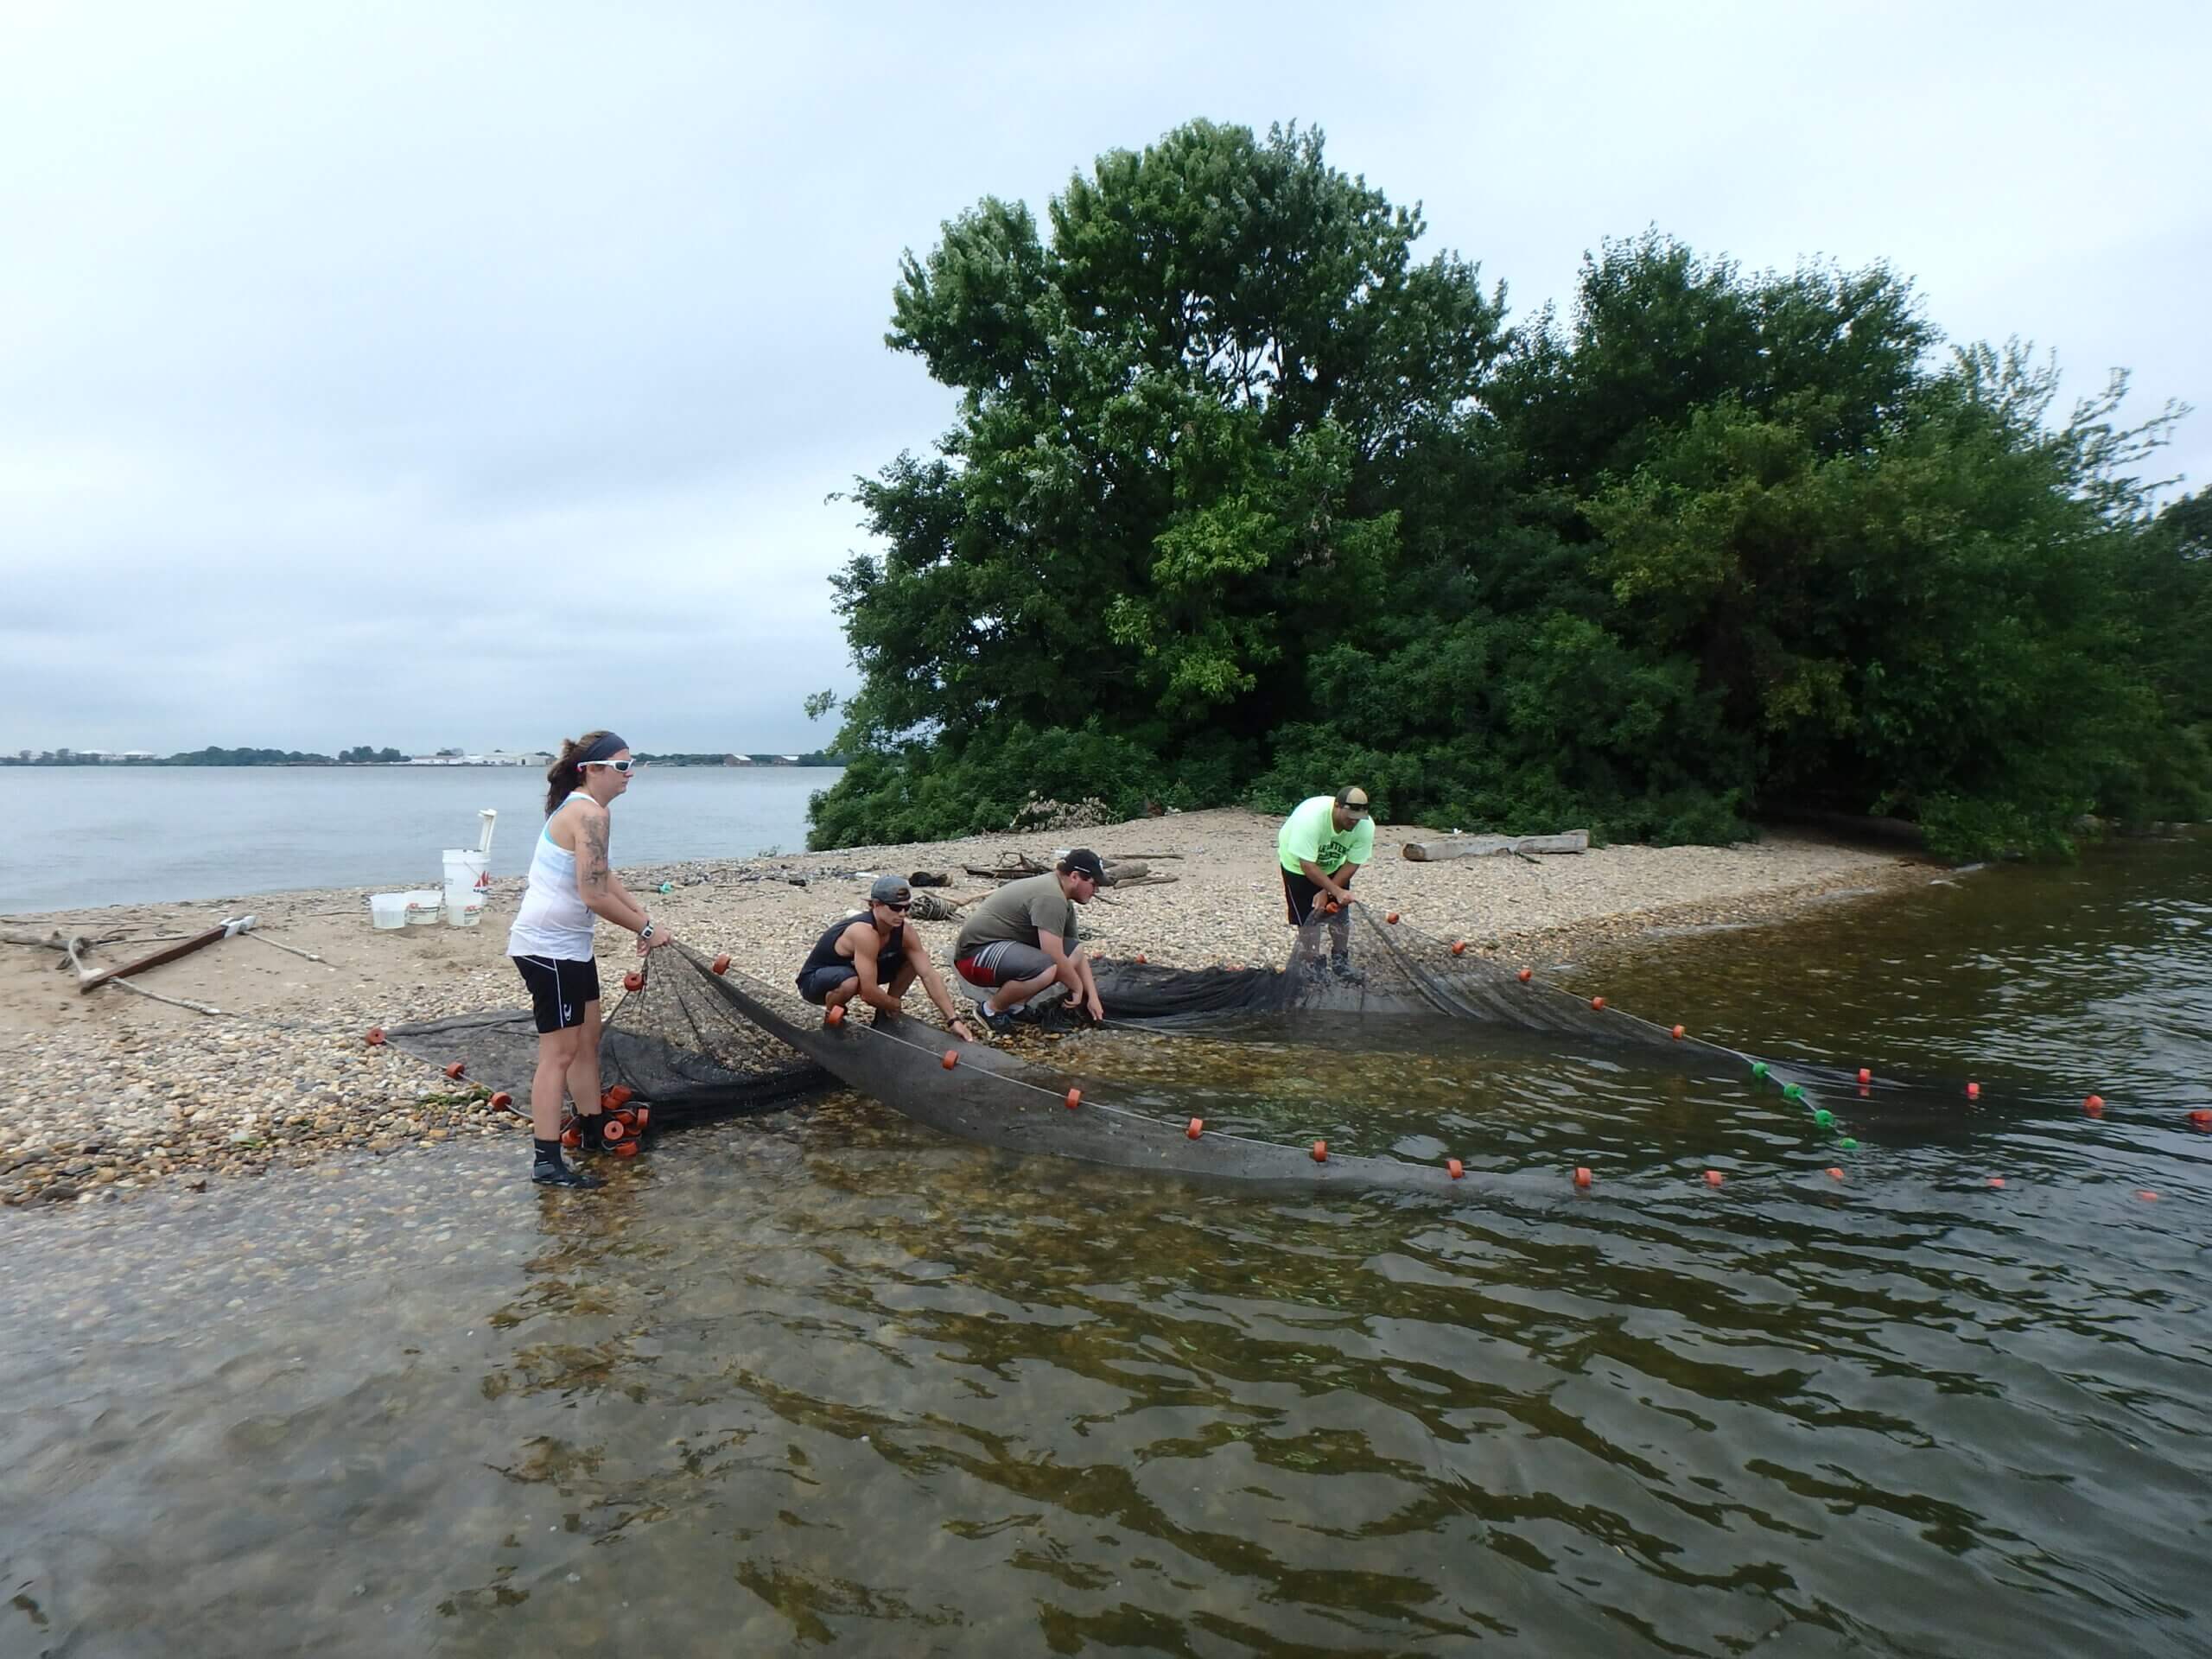
The Delaware estuary, New Jersey’s largest estuary system, is a semi-enclosed body of water where freshwater from the Delaware River mixes with salt water from the Delaware Bay. The estuary is a migratory route for many recreational and commercial fish and provides critical spawning and feeding grounds and nursery areas for many species.
The success of a species is contingent upon the survival of their young. The Delaware estuary provides a suitable nursery environment for young fish to grow. Monitoring populations of these juvenile fish is essential for fishery managers to estimate abundance and evaluate the success of the population. These assessments provide a means to predict population trends and future harvest potential of monitored species.
Bureau of Marine Fisheries biologists conduct several surveys each year to study the status of species populations within the estuary. One of these surveys is the Delaware River Striped Bass Recruitment Seine Survey.
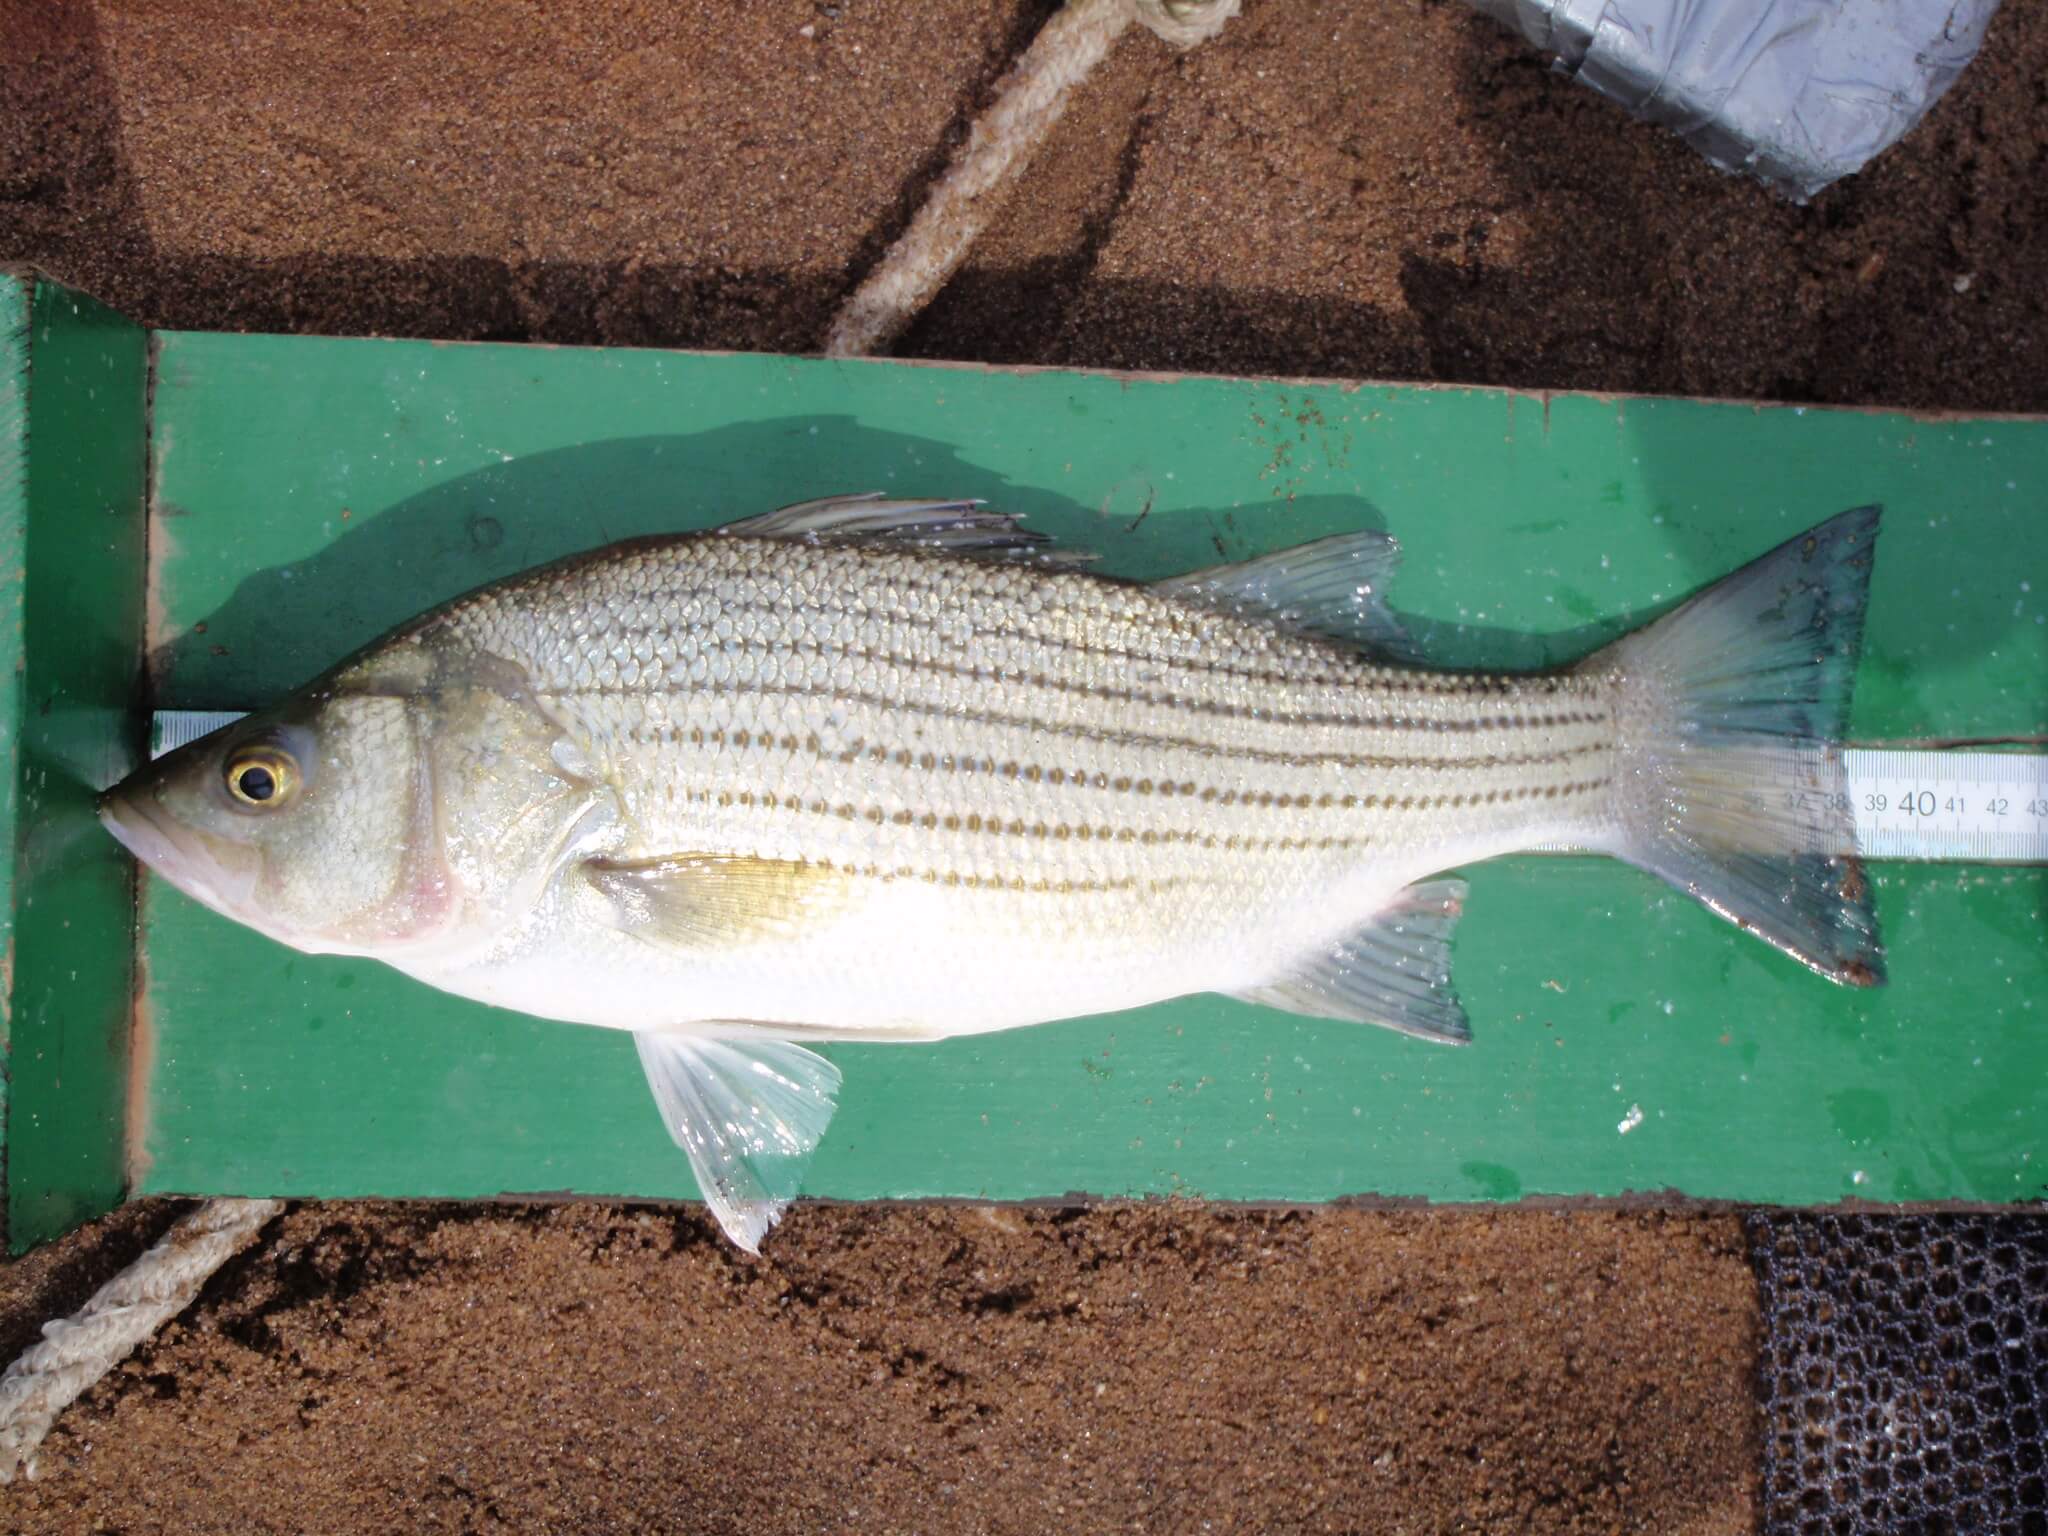
The seine survey is a Fishery-Independent Monitoring Project required by the Interstate Fisheries Management Plan for Striped Bass. It is currently the Bureau of Marine Fisheries’ longest running fishery-independent survey. It began in 1980 when striped bass stocks were severely depleted and is primarily a juvenile striped bass abundance survey. Striped bass migrate into the river during the late winter/early spring months to reproduce. Afterwards, adult fish head back out to the ocean, while the juvenile fish remain in the estuary for several years before heading out to sea to join the coastal population. Data collected during the seine survey provides an annual abundance index for this species, reported as the number of young-of-year per seine haul. Results have been corroborated by other independent surveys, such as the Delaware Division of Fish & Wildlife’s striped bass spawning stock survey.
A unique aspect of this survey is its longevity. Data from such a large period of time is highly beneficial to species population studies. Not only does this survey tell us how many fish there are from year to year, but the data also contributes to the development of fisheries management plans and projections of sustainable harvest levels.
In addition to striped bass, target species include alewife, American shad, Atlantic croaker, Atlantic menhaden, Atlantic silverside, bay anchovy, black drum, blue crab, blueback herring, bluefish, hickory shad, spot, summer flounder, weakfish, white perch and winter flounder. Annual abundance indices are calculated for many species using data collected from the survey; most being reported as the number of fish caught per seine haul.
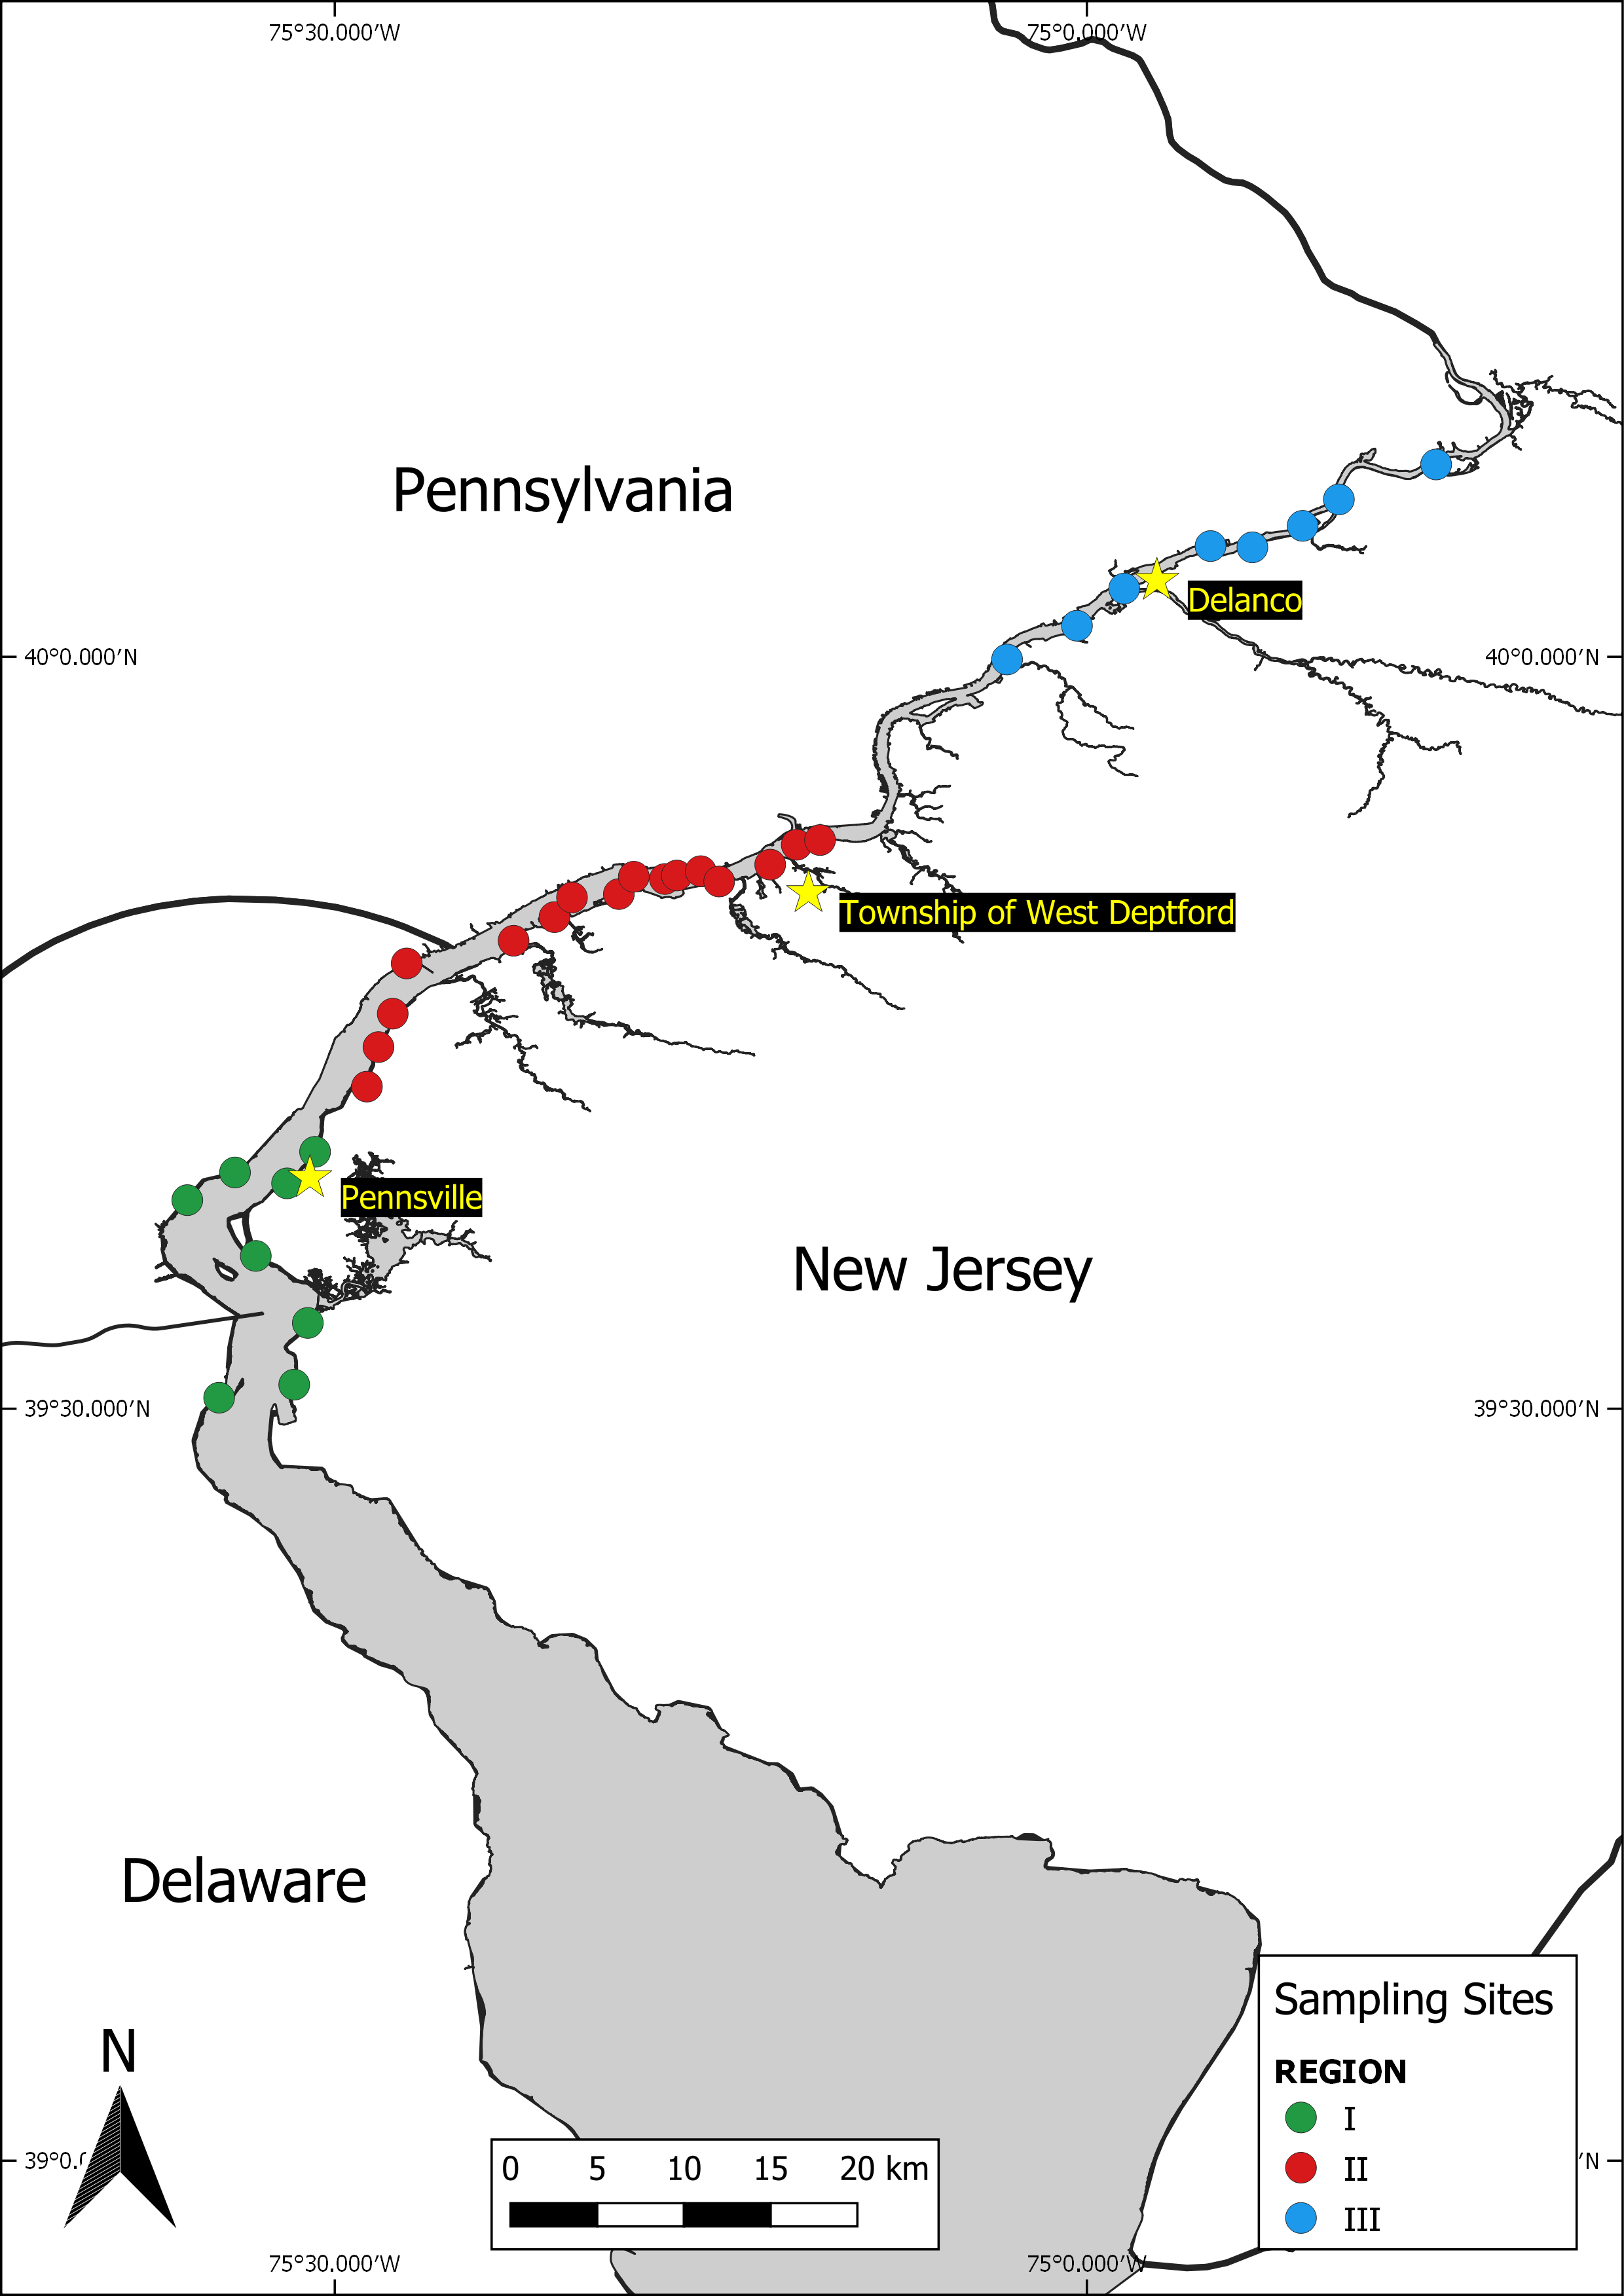
Numerous fixed and random stations along the tidal portion of the Delaware River have been sampled over the years. These stations are spread out between Cumberland County, New Jersey (southern extreme) and Mercer County, New Jersey (northern extreme). Stations are located on both sides of the river in New Jersey, Pennsylvania and Delaware.
The survey area is divided into three tidal regions. Currently, there are 32 fixed stations (beaches): eight in Region 1, 16 in Region 2 and eight in Region 3. These regions have not changed since the beginning of the survey.
- Region 1 is the southernmost sampling area. It is a brackish region extending from the spring saltwater/freshwater interface to the Delaware Memorial Bridges.
- Region 2 is the central sampling area. It is a brackish to freshwater area extending from the Delaware Memorial Bridges to the Schuylkill River.
- Region 3 is the northernmost sampling area. It is a freshwater area extending from Philadelphia to the fall line at Trenton.
Regions 1 and 2 represent historical striped bass spawning grounds. Saltmarsh vegetation predominates along the Region 1 shoreline while Region 2 is primarily urban with a shoreline heavily developed for commerce and industry. Region 3 is sporadically developed by industry with considerable freshwater marsh. Occasionally due to tidal extremes, sediment, SAV presence or construction, alternate sites are sampled.
Sampling seasons have varied over the years. Currently, each station is sampled once in June and bi-monthly from July through October, resulting in 288 seine hauls each year. Changes have occurred to the number of stations, station locations and dates sampled over the years.
The net used is a 100-foot long, 6-foot deep seine net with ¼-inch mesh that has a bag in the middle where the fish are collected.
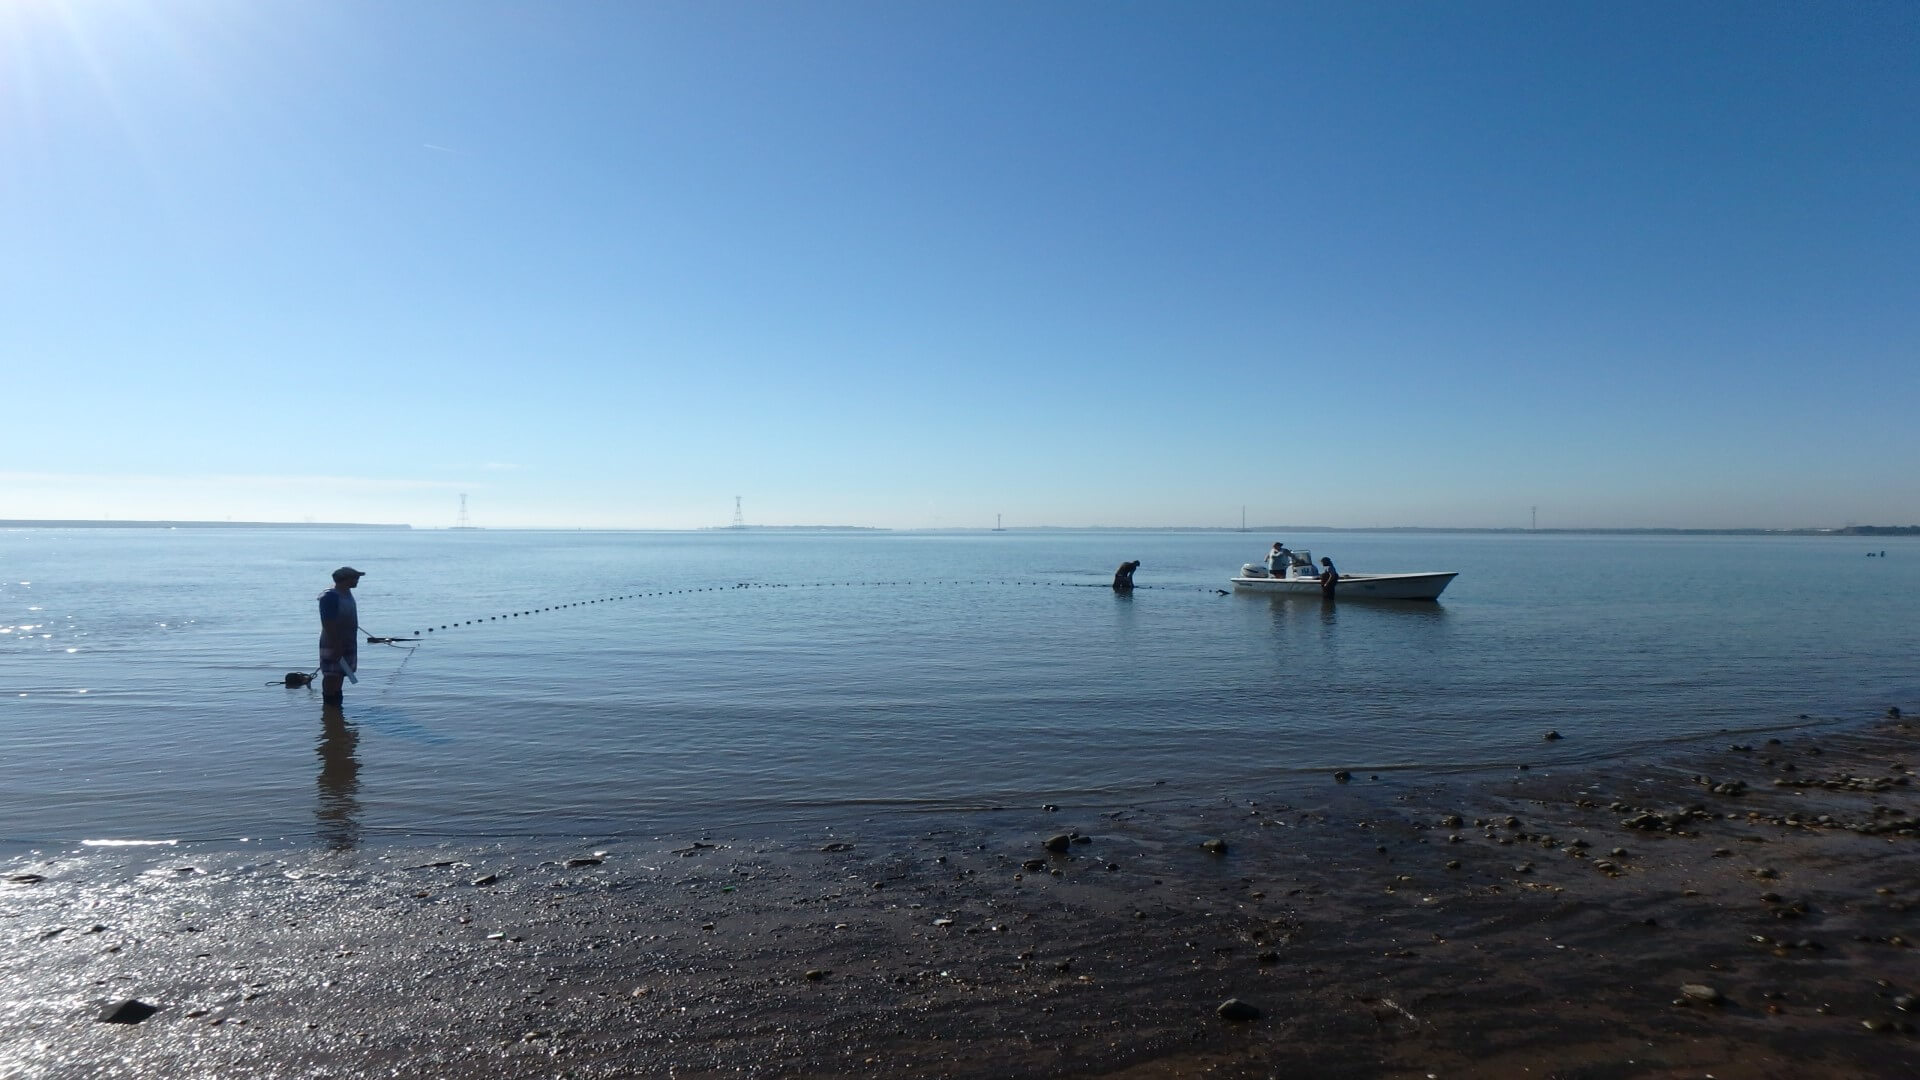
Survey methodology has remained consistent throughout the survey. One end of the net is held close to shore by a crewmember on the beach while the rest of the net is set off the bow of the boat as it backs away from the beach. The boat sets the net with the current, before turning back towards the beach to form a “U” shape. To complete the haul, the net is pulled onto the beach from both ends and the catch is funneled into the bag in the center of the net.
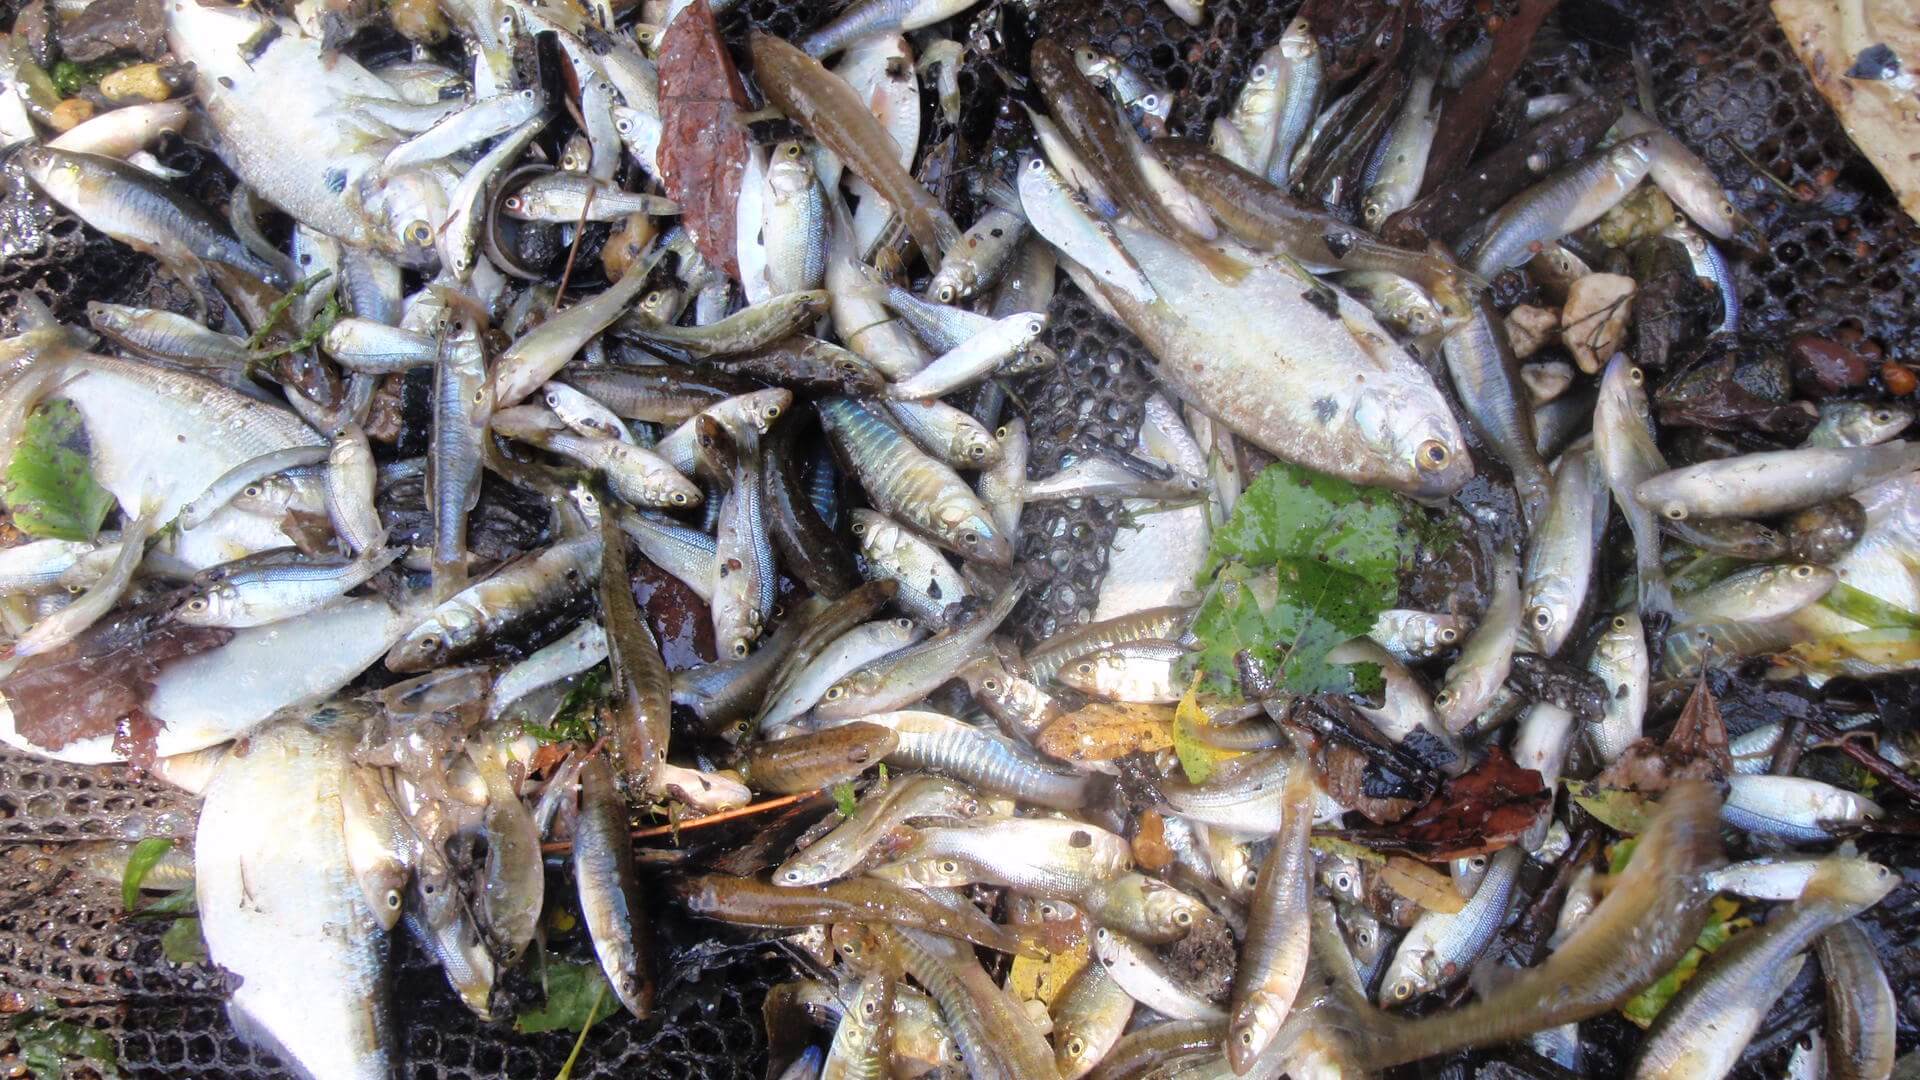
After each haul is complete, all species are identified, sorted, counted and subsamples are measured. In addition to the total number of each species caught, target species including striped bass, require 30 individual lengths be recorded. Once all fish are counted and measured, they are released.
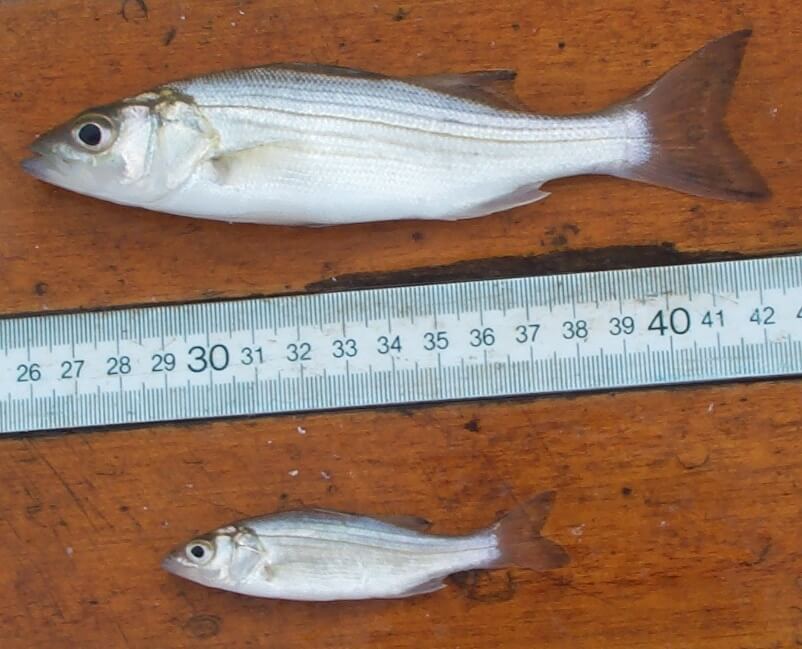
Collecting age-length data from striped bass is another key component of this survey. Scale samples are required from certain size ranges of striped bass to create an age-length key for the Delaware River population. Growth rings on the scales are counted to determine the age of each fish.
Juvenile striped bass abundance is reported as the number of striped bass per seine haul from August through October. Since the survey’s inception, sampling crews have set a beach seine nearly than 10,000 times and caught over 1,500,000 fish, with 96 unique species identified.
Total Number of Each Species Caught
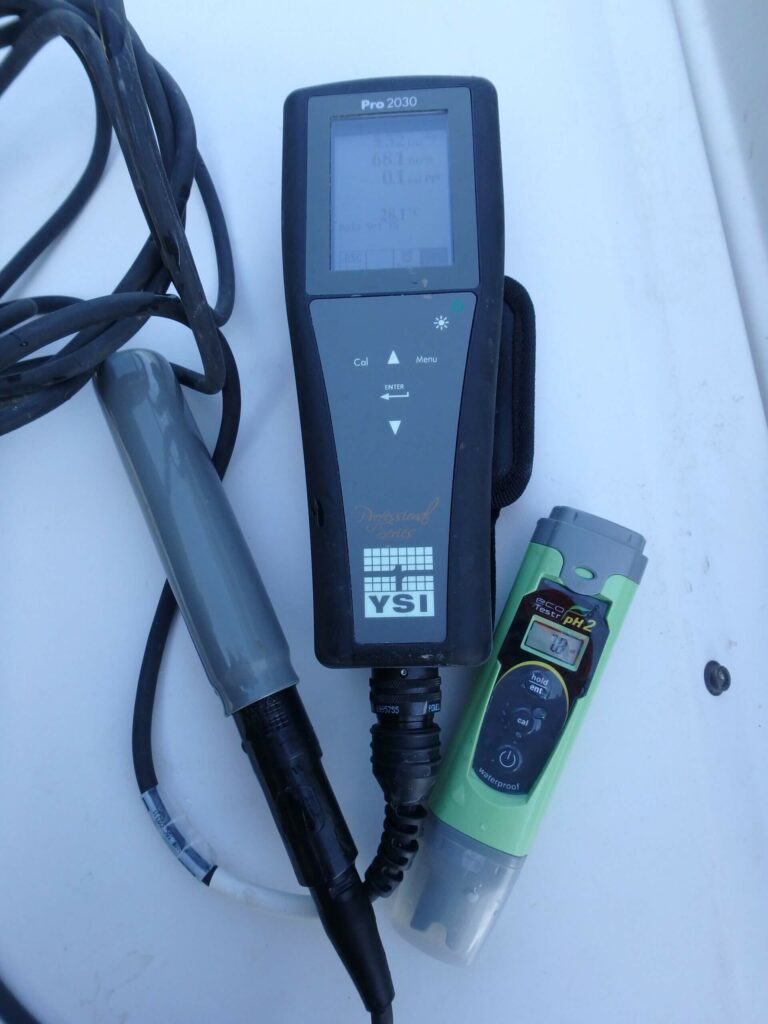
Water quality parameters including salinity, water temperature, dissolved oxygen (DO) and pH are recorded at every station with a handheld DO meter that simultaneously measures several different water quality parameters. The DO meter gives readings within a matter of seconds and provides surveyors with fast, accurate measurements. Because all water quality parameters are influenced by many outside factors, it is necessary to record this data at the site of each seine haul.
In the 1940’s, the water quality of the Delaware River was considered “grossly polluted.” In 1972, the Federal Clean Water Act was enacted, and water quality began to improve. Levels fluctuated until the mid-1980’s when major improvements were finally seen. In 1989, striped bass catches in the river were at a much higher level than previous years. This showed that the striped bass population was rebounding, and water quality was beginning to improve.
Salinity is the saltiness, or dissolved salt content, of a body of water. In the Delaware River seine survey, it is measured in parts per thousand (ppt) which is the measure of grams of salt per liter of water. In a tidal estuary, there are many factors which influence salinity. Freshwater run-off from rainstorms lowers salinity levels, while droughts lead to an influx of saltwater from the ocean. In this survey, Region 1 is the southernmost area closest to the Delaware Bay and has the highest salinity averages. Overall, trends show the salinity of the Delaware River has remained fairly constant through the years.
Water temperature is also affected by many factors, including water depth, tides and the weather. On average, the water temperature during this survey, measured in degrees Celsius, has increased over the years.
Dissolved oxygen is a measure of the amount of gaseous oxygen that is dissolved in water. It is measured in milligrams per liter (mg/L). Oxygen gets into the water by diffusion from the surrounding air. This happens through a number of methods including rapid water movement (tides, run-off or boat traffic) and air movement above the water (wind or storms). Trends show a slight decrease in the overall average of DO in the Delaware River from 1992 to 2012, while recent years have shown a gradual increase in averages. Despite fluctuations, numerous studies suggest that these values will continue to support a healthy, diverse population of species.
pH, potential of hydrogen, is a value based on a defined scale from 0 to 14, defining how acidic or basic a body of water is. The lower the number, the more acidic the water is. The higher the number, the more basic it is. A pH of 7 is considered neutral. Influences like rainfall, vegetation and polluted runoff from developed areas along the water have the biggest impact on pH in the Delaware River. The 2016 sampling year was the first year pH was recorded during this survey. Region 1 has consistently provided the highest pH averages.
Over the past few years, several invasive species have shown up in seine surveys hauls including Northern snakeheads, green sunfish and flathead catfish. These species are not native to the Delaware estuary and are considered dangers to the local ecosystem. Snakeheads are top level predators and negatively impact the populations of smaller species. Green sunfish have large mouths and outcompete native fish. Flathead catfish have few natural predators and consume native species of fish and shellfish. If caught, none of these species should be released alive. Snakeheads should be destroyed and submitted to New Jersey Fish & Wildlife for identification verification.
Regions 1 and 2 are historical striped bass spawning grounds. Results of this seine survey in recent years have confirmed that these regions are just as important now as they were in decades past. During the first three decades of sampling, data from this and similar surveys in other states reflected an increase in the striped bass population along the East Coast. Since 2010, recruitment has been variable, and the Delaware River index has not been indicative of the coastwide trend.
Surveys like this are just the beginning of the stock assessment process for many species. Since the inception of the survey, the abundance of several species has declined. While it is not completely certain why the populations of some species are decreasing, future research is planned to determine the underlying causes.
Seine surveys, as with all fishery surveys, are important for ecosystem management. Not only do they provide information on species abundance, but they also provide a broader source of data on interactions with other species and associations with environmental factors. Without these surveys, biologists could not identify species interactions or habitat alterations that might predict future fishery management needs. With consistent monitoring along the entire New Jersey coast, we can identify declines in species abundance and implement management actions before it’s too late.
In addition to striped bass, biologists recently analyzed the trends of forage fish in the Delaware River using data collected during this survey. Forage fish (common baitfish) are an important part of the river’s ecosystem. Their schooling behavior, size and abundance make them a significant food source for predator species like striped bass, bluefish, weakfish and white perch. These predators are important recreationally, commercially and economically. As a major food source for predator species, forage fish provide sustenance for predators to reproduce successfully. Without healthy forage fish populations, the predator-prey imbalance could be critical to a particular species. To read more about this analysis and what the trends showed, please view the document Wildlife Populations: Marine Fisheries.
Annual Survey Summaries
Additional Information on Species
Project Lead Contact Information
Jennifer Pyle, Fisheries Biologist
Jennifer.Pyle@dep.nj.gov
609-748-2020
Partners/Funding
Funding for this survey is supported by the Sport Fish Restoration Program administered by the U.S. Fish & Wildlife Service.
Additional funding provided by PSEG.