Lessons from Tropical Storm Ida
Directly Resulted in The Loss of Thirty Lives
- Second deadliest natural disaster event to impact New Jersey in a century (See flooding safety tips)
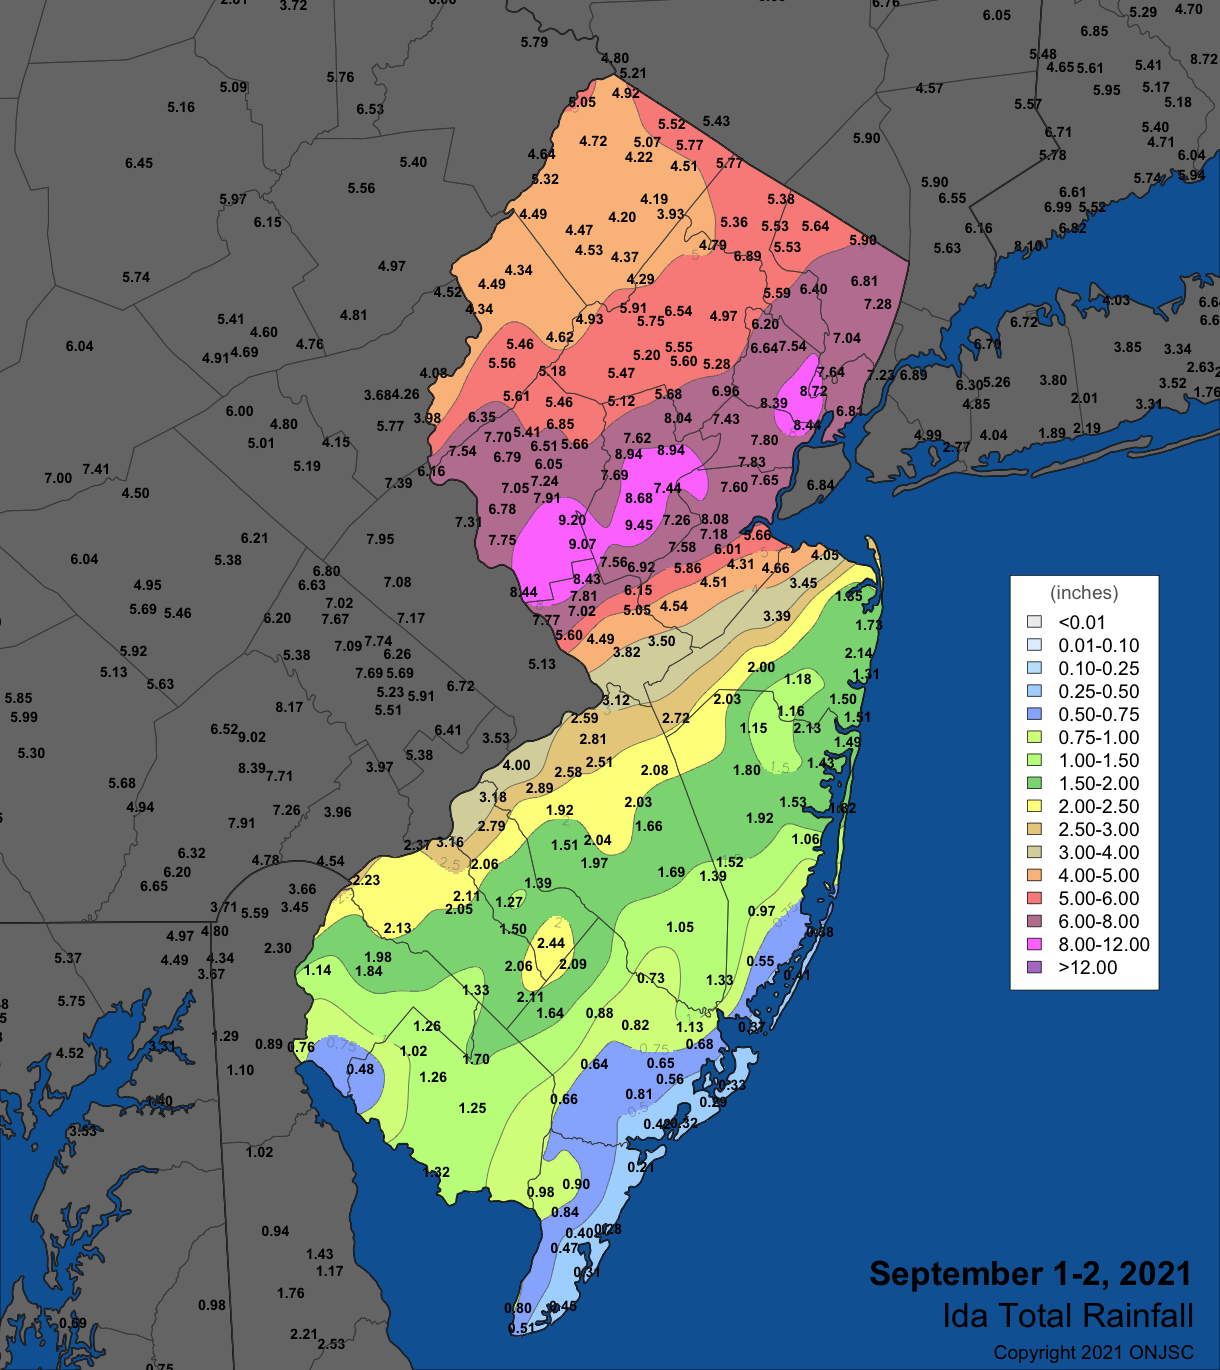
Record Rainfalls
- Newark experienced an all-time record for highest one-hour rainfall total (3.65 inches)
- Documented 10+ inches of rainfall in parts of Hunterdon, Essex, Middlesex and Union Counties
Severe Flash Flooding Due to Intense Precipitation
- Storm sewers were overwhelmed
- Streams and rivers couldn’t convey so much water in such a short time
- More than 12 rivers exceeded their 100-year flood levels
Ida Compared with Existing Flood Hazard Rules
The current FHACA Rules set the design flood elevation (DFE) as the higher of:
- Flood elevation mapped by NJDEP
- FEMA 100-year elevation plus 1 ft
Ida case studies show average elevations of 3.1 feet above FEMA’s 100-year flood elevation
New Design Flood Elevation (DFE)
- To help protect communities from future flood damage, the DFE along streams and rivers will be raised by 2 ft above current standard.
- New DFE is the higher of:
- Flood elevation mapped by NJDEP (where available) plus 2 ft
- FEMA 100-year elevation plus 3 ft
- When calculating flow rates to determine DFE:
- Compute flow rates based on future anticipated 100-year precipitation
- Model design flood based on 125% of the computed flow rates
New Stormwater Management Standards
- Account for existing increased rainfall and prepare for likely further increases results in nominal additional effort or cost during development
- Achieve greater runoff and flood control with, for example, a 2% increase in the amount of property required for stormwater controls
- Deploy regulation consistent with Governor EO 100 approach of utilizing flexible standards commensurate with risk recognizing that no one-size fits all
- See potential increases in the size of stormwater BMPs to accommodate the adjusted rainfall amounts for a warehouse development in examples below


 OFFICIAL SITE OF THE STATE OF NEW JERSEY