General GIS Topics
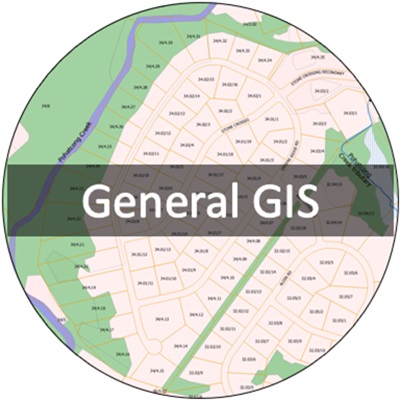
What is GIS?
The term Geographic Information System (GIS) is used generically for any computer-based technique for the manipulation of geographic data. GIS is a broad field of endeavor, and incorporates the related fields of remote sensing and photogrammetry, as well as Global Positioning Systems (GPS). GIS includes not only hardware and software, but also the special devices used to manipulate geographic information to conduct spatial analysis and to create map products, together with communications systems needed to link various elements.
For more information, check out http://www.esri.com/what-is-gis
What is Spatial Data?
GIS data is often referred to as “spatial data” or “digital geospatial data.” The term “geospatial” is derived from “geo” relating to the Earth, and “spatial” relating to location in space. Two broad categories of spatial data are known as “vector” and “raster”. Beyond these main categories, other GIS-related data types include tabular data (database tables) and image data. All of these are discussed below.
Vector data layers are comprised of points, connecting lines and polygons are recorded digitally using X-Y coordinates. Such images are fully scalable meaning they can be enlarged and reduced in size for display without sacrificing detail. Most map layers in GIS are expressed as vector images in order to conserve digital storage space, accelerate retrieval and minimize work involving analytical processing. Raster data layers are comprised of picture elements (pixels) that may be assigned a color value and intensity. An example of such images is a television picture. Raster images lose resolution (detail) as they are enlarged or reduced in size. These images usually occupy more storage space than vector images of the same area and require compression and expansion in use to conserve file space. Raster images usually result from the scanning process and in GIS are typically used for digitizing aerial photographs and background maps.Tabular data, often referred to as attribute data, because it is information that describes the attributes of features in a data layer, is stored in database tables. Rather than describing location, tabular data provides the descriptive information about the features in a layer.
Image data or Digital Imagery is stored as raster data in a GIS and often provides an image as a backdrop to a vector data layer. Examples of image data include digital aerial photography, satellite imagery, scanned maps and photographs. Another term for image data commonly used is digital raster graphics (DRGs). USGS quadrangle topographic maps are often called USGS DRGs. Additional information on image data can be found in the Digital Imagery FAQs.
How is NJDEP using GIS to accomplish its mission?
The use of GIS technology is integral to making better environmental decisions in programs ranging from water resource management to hazardous site clean up to wildlife habitat protection to emergency response. To see some examples of how the Bureau of GIS has facilitated GIS, review the Online Applications and ArcGIS Online Gallery. Read more about us.
Where can I get information about NJDEP GIS standards?
The NJDEP has developed GIS standards to assist staff and other users of the Department’s data. The Mapping and Digital Standards document can be found on the GIS Standards page.
What GIS data has NJDEP made available?
Most of NJDEP’s GIS data is available for download in a variety of formats. Metadata (data documentation) for each layer is available as well.
What do I need to use NJDEP GIS data?
The staff at the NJDEP commonly use:
The ArcGIS suite of software produced by ESRI . Esri’s Explorer for ArcGIS products and NJ-GeoWeb are free tools for Department staff and the public. NJDEP’s DEP-GeoWeb is rich with environmental data. It features many of NJDEP’s most requested data layers that can be viewed and queried in an internet browser.
Explorer products allow users to perform basic GIS tasks such as: panning and zooming data layers; displaying data using classifications, symbols, and labels; and identifying and querying geographic and attribute data.
Some NJDEP data sets are also available through subject specific applications on the NJDEP web pages.
Can I redistribute NJDEP data?
The NJDEP requires that permission be obtained prior to redistributing the Department’s data, and that the NJDEP Data Distribution policy be adhered to. For details, review the NJDEP Mapping and Digital Data Standards (pdf) document, section VII NJDEP Data Distribution and Constraints.
Can NJDEP produce a map for me, or furnish customized data retrievals from the NJDEP GIS database for my study?
While NJDEP cannot fulfill individual maps requests, we can provide quality data and interactive mapping applications that may enable you to produce the information you are looking for.
Can anyone make a map online using NJDEP data?
Yes, by using NJ-GeoWeb. Anyone can use NJDEP GIS data without the need for downloading specialized software or data layers. NJ-GeoWeb runs in a browser and can be used to prepare maps you can print on your local printer. Online help, tutorials and training are available so that even those who are new to GIS should be able to use the NJ-GeoWeb application.
Does NJDEP offer any other GIS training?
Please see the training page for more information.
How do I obtain NJ State Plane coordinates for my DEP Permit Application Form?
This information can be obtained by using the either NJ-GeoWeb interactive mapping application which displays NJ State Plane map coordinates in the map window.
Please refer to Find State Plane Coordinates Guide
In order to be confident in the accuracy of the coordinates at the mouse cursor, you should zoom-in close enough that the location can be easily identified using the aerial photography and other base map layers.
If you prefer, you can also call the GIS Help Desk at 609-777-0672 or email: GISNET@dep.nj.gov to obtain this information.
Where can I find historical aerial photography, base maps, etc.?
NJ-GeoWeb includes some historical aerial photography.
Non-digital historical aerial photography can be viewed at the NJDEP Tidelands Management Program aerial photo library. Appointments can be made by calling 609-292-2573.
For information on New Jersey base maps, view the NJDEP Mapping and Digital Data Standards document and/or visit the NJDEP Maps & Publications web site.
What are map projections and coordinate systems and why are they important?
All geographic data layers store locations in a map projection or coordinate system. Map projections and coordinate systems are important because in order for data layers to overlay correctly, they must be stored in the same system. Examples of coordinate systems include Latitude and Longitude, Universal Transverse Mercator (UTM), and NJ State Plane (pdf). These systems relate to the way locations on the Earth are stored in a data layer, and the need to make adjustments when translating locations from a sphere-shaped Earth to a flat map. For more information go to USGS Map Projections web site.
The standard coordinate system used by NJDEP is the New Jersey State Plane Coordinate System, NAD83. Units of measure are in feet. All data layers available for download are in the New Jersey State Plane Coordinates (NJSPC).
Additional information on map projections and coordinate systems is available at the USGS Bulletin.
Where can I obtain a coordinate conversion utility?
The New Jersey Division of Water Supply and Geoscience provides a coordinate conversion utility for converting coordinates to/from Latitude/Longitude and NJ State Plane feet.
Other geodetic software utilities are available to download for free at the web site of the National Geodetic Survey (NGS).
Why am I having trouble launching or using the NJ-GeoWeb application?
Please contact the GIS Help Desk at 609-777-0672 or email: GISNET@dep.nj.gov
Digital Imagery
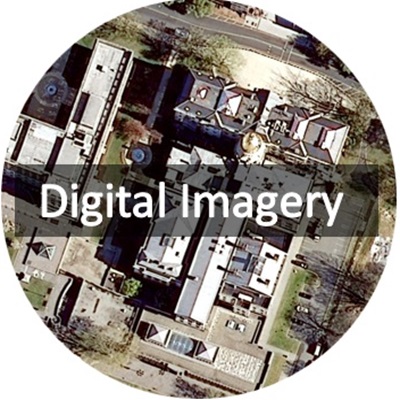
What is digital imagery?
Digital imagery is a computer compatible version of an aerial photograph, satellite photo or other map image. While there are many specific types of digital image formats, they all are examples of raster files. Rasters use a grid structure made up of small individual cells, or pixels (which is short for ‘picture element’), to store and display information. In the case of a digital image, each pixel stores information on the wavelengths of light that are reflected off of the features being captured in the image.
As with regular photographs, digital images can be either pan-chromatic (commonly referred to as black and white or gray scale images) or color. For a pan-chromatic image, the information stored in each pixel is a single value that a computer uses to display a gray shade for each pixel. For color images, each pixel stores information on the three color bands that make up the visible light spectrum—red, green and blue. Computers can use the values for the three bands to recreate the natural color of the object represented in each pixel when the digital image is displayed on a computer screen. Digital images can also store information from other light bands that are reflected from a feature, such as the infrared band, or other bands known as hyper-spectral bands, and these values can also be used by the computer to display the images. Whatever band values are being stored, when the digital image is viewed in a computer or GIS, the individual features in the images are represented by groups of many pixels with specific gray or color band characteristics that, when viewed together, allow each feature to be discerned in the display screen.
How are digital images generated?
Digital images can be generated in several ways. Often, a digital image is made from a non-digital photo or map that exists in what is called hard copy format. The photo or map can be scanned in a digital scanner that converts the hard copy photo or map into a digital raster image file, made up of a large number of pixels as described above. Many of the digital images the NJDEP has available in the GIS are of historic photographs and maps that were taken or generated before computers and GIS were developed. These historic photos have subsequently been converted to digital images files using one of these digital scanners.
Increasingly, however, digital images are now being directly generated using digital image cameras and sensors that output image files directly in digital image formats. The 2015 and 2020 statewide imagery layers available in NJ-GeoWeb are examples of digital imagery produced using this technology. These digital images were generated directly using a digital camera housed in a plane that flew over the state, with no photographic film being produced. Satellite systems, such as those used in the NASA/USGS Landsat program, have been using digital sensors to collect imagery for some time. This technology has now matured to a point where it is routinely used on most large scale image collection projects such as a New Jersey statewide overflight.
What kinds of digital image files are commonly used in a GIS?
There are many types of digital image files which are reflective of the many types of software systems that can generate and view digital image files. Each of these can be identified by a unique file extension. The most common formats used in the NJDEP GIS and their extensions are:
GEOTIFF: a TIFF file with geographic coordinate information imbedded in the image (.tif)
JPEG: (Joint Photographic experts Group) (.jpg)*
JPEG2000: An advanced version of the JPEG file (.jp2)*
ERDAS IMAGINE: (.img)
MrSID: (Multiresolution Seamless Image Database) (.sid)*
ArcInfo Grid: Raster format developed by ESRI (no extension)
The asterisk indicates a compressed image format. Images file sizes can be very large, often reaching several hundred megabytes for a TIFF or IMG file, or more. The JPEG, JPEG2000 and MrSid files are formats that have been developed to compress the original image files to more manageable sizes without losing too much detail of the image.
Note that all of these formats can be used directly in the GIS. However, for many of the image layers available in DEP-GeoWeb, the images are converted to one of several ArcGIS formats, such as a geo-database raster, mosaic dataset, image catalogue or image service, to improve drawing these large data sets.
What makes a digital image in the GIS system different than one that can be taken using a simple phone camera or personal digital camera?
While digital images that are taken with your phone or hand held digital camera are similar to those in the GIS in that they are all raster files made of millions of small pixels, images used in a GIS have some other special characteristics. GIS digital images have been processed so that they have a specific ground coordinate system associated with them. In other words, the images have been given real world coordinates that the GIS can use to place the image in its real world location in relation to other mapped data.
How is the coordinate information attached to the digital image file?
There are several processes that can be used to give digital images coordinate referencing. The simplest process is known as geo-referencing. In this process, a digital image without coordinates is given coordinate referencing either by using coordinate information that is collected by field surveying locations covered in the image, or by comparing the image with another digital image of the same area that does have coordinates, using a computer program. In the first case, coordinates of several ground features visible in the image are determined by surveying those locations using standard survey techniques or global positioning systems (GPS). The surveyed features are then located when the digital image is displayed on a computer screen and assigned the coordinates determined during the field survey. A computer program then uses the coordinates from all of the surveyed points to generate a real coordinate space for the entire digital image, with every pixel in the final image having real world coordinates generated for it.
In the second case in which an un-referenced image is compared with a referenced image, several features identifiable in both images are selected to be used as link points. As the link points are selected, a computer program transfers the real coordinates of each feature from the referenced image, to the same features in the un-referenced image. The computer then uses this information to generate a coordinate solution for the entire image being referenced.
A more robust process that is used in some digital image processing is known as ortho-rectification. Ortho-rectification uses steps similar to those used in simple geo-referencing. But the process also includes additional steps that further remove image displacements that occur because of terrain relief. In ortho-rectification, a 3-D model of the ground surface is generated using a digital elevation model (DEM) of the area covered by the image. By accounting for terrain displacement, the true coordinate space of the image can be generated more accurately, resulting in the processed image having a consistent scale throughout the entire image.
What digital images are available to NJDEP staff?
NJDEP has several sets of digital imagery available through the various GIS applications maintained by the BGIS. Here’s a list of what is available as of 12/12/2018
How do I access the digital images available in NJDEP GIS?
NJDEP staff who need to access the digital aerial photography can do so by using one of the several GIS applications the NJDEP maintains: ArcGIS Desktop, ArcGIS Pro, or DEP-GeoWeb. All of the imagery listed above is available in these applications from easy to use pull-down menus, and can be turned on or off using simple mouse clicks. More information on these ArcGIS applications and other GIS topics is available in the General GIS Topics and the GIS Technical Support FAQs.
What is meant by pixel size or image resolution?
Image resolution refers to the actual ground area each pixel represents, in units of the coordinate system used to reference the image. For example, the 2012 statewide digital imagery available in the NJ-GeoWeb, which is referenced in New Jersey State Plane Feet, has a resolution of 1 foot, meaning each pixel in the image represents a 1 square foot area of ground surface. Image resolution is an extremely important characteristic of the imagery, since the higher the resolution, that is, the smaller area each pixel represents, the more detail that can be seen in the image.
Is image resolution the same as image accuracy?
Image accuracy and image resolution are two different characteristics of digital imagery. As described above, resolution refers to the ground area represented by each pixel. Image accuracy is actually a reflection of how close coordinates of features measured from the image after it is referenced are to the actual ground coordinates of those features determined from ground surveys, or from other images that have a tested accuracy level. For example, the 2012 digital imagery has a tested accuracy of +/- 4 feet, meaning that coordinates extracted from the digital image will be within + or – 4 feet of the coordinate values determined if one were to go out and survey the location of that feature. Images can have different pixel resolutions and the same accuracies, as well as the same pixel resolution and different accuracies.
What resolutions and accuracies are characteristic of the digital images found in NJ-GeoWeb?
Unfortunately, not all of the digital image layers used in NJ-GeoWeb have a ground accuracy level measured for them. This is true of many of the layers made from historical photos and maps, which generally had no coordinate information collected at the time the map or image was generated. A representative accuracy can be determined by making some measurements in GIS when viewing each historical image layer. But since the accuracy may vary from place to place across each image, this measurement can only be used as a general guide.
For other data sets, however, particularly all of the ortho-rectified imagery, a tested accuracy is available for each image layer. The first ortho-rectified dataset produced for NJDEP, the 1995 imagery CIR imagery, was produced to meet a USGS accuracy for images produced at a scale of 1:12000, which means an accuracy of +/- 33 feet. For later imagery such as the 2002, 2007 and 2012 image layers, the tested accuracy is +/- 4 feet. So there is a great range in the accuracy of the various image sets. If an accuracy test has been performed, it will be listed in the metadata for that image layer.
What types of digital imagery does the NJDEP have?
There are several types of digital imagery on the NJ-GeoWeb. Some of the imagery layers, such as the 1991 imagery, are pan-chromatic images, which means they are displayed only as gray scale images. Other imagery, such as the 2003 imagery, is available as true color imagery. Still other imagery, such as the 1995 and 2002 imagery, is available as color infrared (CIR) imagery.
What is CIR imagery?
Normal color imagery is collected using the visible part of the light spectrum, with all colors really only a combination of the three primary colors—red, green and blue. A true color digital image is really made up of three bands, one for each of the primary colors. When the three bands of the image are displayed on a computer, the result is the true color of the object based on how much red, green and blue light reflects from the object.
For CIR, or color infrared, imagery, the camera or sensor used to collect the imagery can also sense light in the non-visible portion of the light spectrum, specifically in the near infrared portion, by using special filters. This infrared data is collected in a separate band which can be substituted for one of the primary color bands to generate a false color or color infrared display on a computer. Generally, the three bands of a CIR image display are the infrared band, the red band and the green band, with the blue band not being used. What this band arrangement results in is a shift in the colors used to display various features. For instance, since blue is not used, anything that was blue true color generally shows up as black in a CIR image. In addition, since the red color gun in the monitor is being used to display the green color band, features normally shades of green in a true color image show up as shades of red and pink in a CIR image. Although the color balance is not what one would expect to see, CIR images are very useful in doing many types of analysis since many characteristics of features are more defined when seen in CIR images than in true color images. This is particularly true of vegetation since characteristics such as canopy arrangement, leaf structure, water content, and general growth vigor, among others, are more discernable using infrared reflectance.
Note that some of the image layers, particularly the 2007 and 2012 imagery, have both a true color and a CIR version of the imagery available. This is because the imagery for these data sets was collected using a digital sensor that could collect data for the red, green, blue and infrared bands all at the same time. All four bands are stored as part of the image file, and the GIS can be used to simply select the three bands to display to produce a true color or CIR image set.
Is any of the imagery available to the public?
Yes. There are several ways for the public to access most of the imagery available to DEP staff. Many of the imagery layers are available in the public versions of NJ-GeoWeb. The same image layers are also available through NJGIN which is a site hosted by the Office of GIS of the NJ Office of Information Technology. There are image services available from the NJGIN site that can be added to most GIS mapping software applications. So outside parties that have their own GIS can go to the NJGIN site and add the image layers directly to their own applications. The NJGIN site also has some of the image files available for download, so that users that cannot take advantage of the image service format, can still get some of the image files. The NJGIN site has directions both for ordering the image files and for accessing the image services.
What can the digital imagery in the GIS be used for?
Since all of the image layers available in the GIS have coordinate referencing associated with them, most importantly, they can be used as a base to overlay other referenced digital data. This would include every data set available through the NJDEP GIS data download site. In addition, any other data set that has a coordinate reference defined for it that may have been generated outside of NJDEP can also be added to a GIS application with the imagery for analysis and comparison.
Data can also be generated using the digital imagery as a base, and much of the data available in the NJDEP is generated using heads-up data generation techniques with the digital imagery. Since each of the imagery layers has its own resolution and accuracy characteristics, there are different levels at which each image set can be used to generate reliable data. The table in above includes some suggested scales at which it would be appropriate to generate data from each image source. These scale levels are not hard and fast requirements, but do provide good starting points for generating data from each of the image layers.
Lastly, measurements and coordinate locations can be determined using the imagery as a base. Distance measurements, determination of the area of a polygon, and the X and Y coordinates of point features can all be determined from the referenced imagery sources. Since the 2002, 2007 and 2012 image layers are fully ortho-rectified layers with a tested accuracy level, they would be the best sources to uses to determine coordinate locations or length and area measurements. But similar measurements can be made using all of the referenced image layers listed in the table.
LiDAR
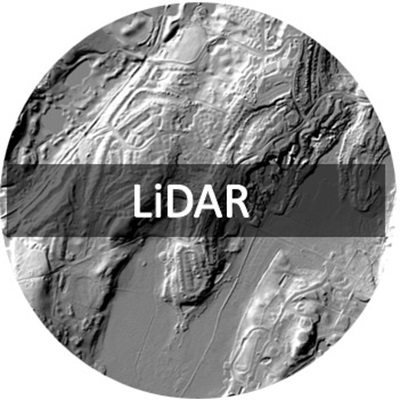
What is LiDAR?
LiDAR, which is an acronym for Light Detection And Ranging, is an active remote sensing technology that uses laser light pulses to gather information about the features being scanned. Light pulses are emitted from a light source that can be housed in an airplane, helicopter, ground vehicle, or even a stationary terrestrial platform, and the times that it takes light pulses to hit an object and return to a sensor are recorded. Those times are then used to calculate distances traveled, and, most often, elevations of the object struck by each light pulse. Because LiDAR data can be collected over large areas in a relatively short time period, and because of the elevation accuracies that LiDAR systems can now achieve, commonly +/- 10-15 centimeters, LiDAR is now a primary source of elevation data for generating bare earth digital elevation models (DEM).
What comprises a LiDAR collection system?
While there are many types of LiDAR systems, they all share some common elements. All systems, both airborne and terrestrial, will have a laser light source, a sensor to capture the return pulses, and a GPS positioning device to record positional coordinates of all source and object pulses. If the system is an airborne one, there will also be an inertial measurement unit (IMU) on board. IMU’s track the pitch, roll and yaw characteristics of the airplane. These measurements are used to determine the airplane’s true position in relation to the ground surface being sensed at all times. This position needs to be known precisely to correctly calculate the travel time, distances and elevations of the pulses and objects.
What does a LiDAR data set consist of?
LiDAR collection systems generate massive data files with records of every pulse return that is generated over a study area. These data files are generally referred to as point clouds or mass point files. Both of these are good descriptive terms for a LiDAR data set since, in a standard LiDAR project, there may be on the order of 5 to 10 million points collected for each square mile of ground surface studied. LiDAR data sets really are masses or clouds of extremely large numbers of data points.
What formats are used to distribute LiDAR point clouds?
LiDAR data can actually be presented in a simple ASCII text file that includes just an x, y and z value for every return point processed. This was the format that early LiDAR collections used. However, because there can be much other information collected or processed for each return, most LiDAR data is now provided in a special binary file called a LAS file, (LAS coming from LASer). So that LiDAR data from different systems can be used together, the American Society for Photogrammetry and Remote Sensing (ASPRS) has now developed standards for LAS file formats, and all LiDAR data now generated usually are provided in a standard ASPRS LAS format.
What kind of information is in a typical LAS file?
Besides the x, y and z data included in a simple ASCII file, the LAS file includes important header information about the collection, time stamps for each point, intensity of the return pulse, coordinate system used, number of returns per light pulse, classification of the type of feature the light pulse struck, and many others. Below is a table with attributes from a typical LAS file, as well as attributes from a single point in the file:
Source File Info |
|
| File Name: | 18TWL790045.las |
| File Size: | 309,201 kb |
| File Date: | Thu Oct 23 08:34:10 2014 |
| File Type: | LAS |
| File Signature: | LASF |
| File Source ID: | 0 |
| Adjusted GPS Time: | 1 |
| LAS Version: | 1.2 |
| System Identifier: | NIIRS10 |
| Generating Software: | LiDAR1 tiled |
| File Creation Date: | October 22, 2014 |
| Per-point Time: | YES |
| Per-point RGB: | NO |
| Total Points: | 11,042,384 |
| First Return: | 10,597,661 |
| Second Return: | 410,496 |
| Third Return: | 33,676 |
| Fourth Return: | 549 |
| Fifth Return: | 2 |
| Min X: | 579,000.000 |
| Max X: | 580,499.980 |
| Min Y: | 4,504,500.000 |
| Max Y: | 4,505,999.980 |
| Min Z: | -11.020 |
| Max Z: | 400.820 |
| Estimated GSD: | 0.461 |
| X File Precision: | 0.010000 |
| Y File Precision: | 0.010000 |
| Z File Precision: | 0.010000 |
| Coordinate System: | NAD_1983_2011_UTM_Zone_18N |
| PCS Citation: | NAD_1983_2011_UTM_Zone_18N|projection: Transverse Mercator |
| Geographic Citation: | GCS Name = GCS_NAD_1983_2011|Datum = NAD_1983_2011|Ellipsoid = GRS_1980|Primem = Greenwich |
| Vertical Citation: | NAVD88 – Geoid12A (Meters) |
| Horizontal Units: | metre |
| Vertical Units: | metre |
Sample Point Info |
|
| File: | 18TWL790045.las |
| X: | 579,089.95 m |
| Y: | 4,505,789.69 m |
| Z: | 13.00 m |
| Intensity: | 13 |
| Return Number: | 1 |
| Number Returns: | 3 |
| Scan Direction: | 0 |
| Line Edge: | 0 |
| Classification: | 1 |
| Classification (8-Bit): | 1 |
| Scan Angle: | -0.7087 deg |
| User Data: | 0 |
| Point Source ID: | 170 |
| Withheld: | 0 |
| Synthetic: | 0 |
| Keypoint: | 0 |
| Time: | 1,018,084,530.00000 sec |
What is meant by the return number?
A single light pulse can actually hit multiple targets, and so generate multiple return pulses. If you think of a flashlight being used in a dark room, part of the light beam may strike and illuminate the first chair encountered while part of the light beam my strike an illuminate the table partially behind it, and yet another part strikes and illuminates the wall. Laser light pulses sent out during a LiDAR survey act in the same way, with the various returns normally being from such things as roof tops, tree branches, cars or finally the ground surface. LiDAR systems have the capabilities of tracking several returns from each light pulse sent out, with each source pulse and it’s multiple returns all being linked in the data file. It’s this characteristic of a multiple return LAS data set that allows the point cloud to be used to generate a 3-D view of the area surveyed in many software applications an example of which is shown in this graphic:

How about point classification?
One of the important features of the post processed LAS file is the classification of each return, or more correctly the classification of the type of feature the light pulse struck. Normal feature types include bare earth, water, low vegetation, medium height vegetation, high height vegetation, and buildings, among others. At a minimum, returns are usually classified to be water, bare earth and non-bare earth points, with other types of non-bare earth points, such as buildings and vegetation, included depending on the use of the data. Having the bare earth points classified, allows the point cloud to be used to create the bare earth or ground level digital elevation model (DEM) of the study area, which is one of the primary uses of airborne LiDAR data. The standard APSRS file format has reserved class codes for these primary point classes with bare earth points always given Class 2, and water points Class 9.
Why is the time in the LAS file given in seconds instead of a normal date?
Times recorded for light pulses collected in a LiDAR project are given in a system called GPS time, since GPS data are integral to tracking the LiDAR pulses. GPS time started at midnight Sunday, January 6, 1980, which is when the first GPS satellites became active. It is counted by the number of seconds in each week since January 6, 1980, which is week 0 (zero). The time stamp for a LiDAR point is the total number of seconds that have elapsed from midnight January 6, 1980. GPS time converters are available that can convert the total number of seconds to an actual date. For example, the time of 1,018,084,530.0000 seconds given for the sample point above equates to a date of April 10, 2012, 9:15:15 AM.
Are point clouds the only LiDAR data sets available?
The raw and post processed point clouds, often called the unclassified and classified LAS files, are the data format in which the actual point returns are delivered. While the point clouds are extremely valuable for performing many kinds of surface analysis, it is the derived LiDAR products which are most widely used. Included in these derived products are bare earth digital elevation models (DEM), first return digital surface models (DSM), hillshade files (shaded relief surfaces), triangulated irregular networks (TIN), and elevation contours. The most important of these are the DEM and the hillshade file. The DEM is a raster data type with each cell or pixel storing a ground elevation value calculated from the bare earth points in a LiDAR collection, and can be used in a many different GIS raster processing operations. The hillshade file is simply a 3-D shaded relief layer of the DEM, and is very helpful in visualizing what the terrain actually looks like. Contours, which are vector layers linking points of the same elevations, are also a common LiDAR derived product, and familiar to most people as one of the data types shown on a topographic map.
Where can one get LiDAR data for New Jersey?
There are several sources for New Jersey LiDAR data, both the raw and classified point clouds and the derived products. The Office of GIS (OGIS) within the Office of Information Technology is presently the state branch handling the distribution of LiDAR data sets covering New Jersey. Because of the size of the collections, distribution from OGIS is by request, with the distribution on external hard drive. Read the instructions for acquiring the data from OGIS.
New Jersey LiDAR data is also available from several federal distribution sites. The USGS posts LiDAR data sets for download on several sites including EarthExplorer, and The National Map. LiDAR data covering coastal areas of New Jersey are also available from NOAA’s DigitalCoast site.
GPS
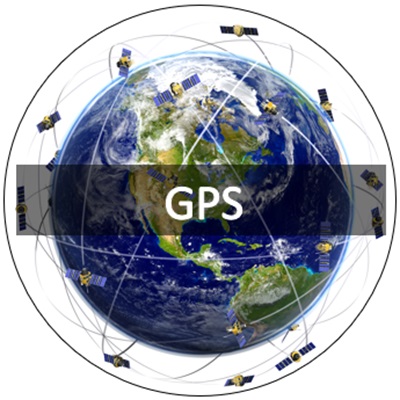
What is GPS?
GPS stands for Global Positioning System, and is a satellite based navigation system. The system consists of satellites, operated by the US Department of Defense, which orbit the Earth and transmit coded signals with information on satellite positions and time. Earth-based GPS receivers obtaining signals from no fewer than four satellites can calculate accurate horizontal and vertical position. Four GPS satellite signals are needed to compute positions in three dimensions and correct the time offset in the receiver clock.
What is a base station?
A base station is a GPS receiver that collects GPS measurements at a known location. Its main components are an antenna, a GPS receiver, and a device to which the GPS data is logged – most often a personal computer. The antenna’s location is determined very accurately (to within a few centimeters or less) by surveying methods. A base station provides reference data that can be used to increase the accuracy of GPS data collected in the field.
Why is a GPS base station needed?
Under normal circumstances a GPS receiver should be able to determine a fix for a user’s location to within 10 meters. Very often, the results are in the 5 to 7 meter range. To consistently achieve better than 5 meter accuracy, GPS measurements from a base station are needed to differentially correct GPS measurements determined in the field.
Several sources of error related to timing, satellite orbits, and the atmosphere affect GPS measurements. The GPS measurements collected by a base station are used to model these error sources at any given time. Since the measurements at the base station are collected at a known location, these sources of error can be determined and used for improving or correcting field data that was/is collected at the same time. The differential correction can be performed on field data after the data has been downloaded to a PC running GPS data processing software (post-process correction), or performed in real time while the field data is being collected. Generally the post-process correction solution is more accurate, and is favored over the real time solution when requirements dictate achieving higher accuracy. Real time correction still typically provides better than 5 meter accuracy, but users might not always be able to receive the correction signals in all environments. Naturally, the real time solution has advantages when using GPS for navigation.
Base stations collect and store GPS measurements for later retrieval by users. Some base stations also transmit correction data that are used for real time differential GPS. Many newer GPS receivers have WAAS (Wide Area Augmentation System) correction capabilities. WAAS is a satellite based real time correction solution that was initially designed to aid aircraft navigation.
Where can I get base station data for my system?
Your best option is to acquire base data from one of the National Geodetic Survey (NGS) Continuously Operating Reference Stations (CORS). The closest stations are located at Trenton, NJ; Sandy Hook, NJ; Newark, NJ; Warminster, PA; West Chester, PA; Dover, DE; Reedy Point, DE; Palisades, NY; and East Moriches, NY. Base data from these sites can be downloaded over the Web by accessing the NOAA CORS site.
What does each base file contain?
Among other things, each file consists of GPS positions, range measurements (pseudoranges to all satellites in view), and carrier phase data collected over the course of one hour. The files are compressed to an executable file. Depending on your GPS processing software, you may have to uncompress the files. To do this, double click on the file’s icon. This should create a decompressed version of the file. The decompressed file will have the same filename as the compressed file, but with an .ssf extension.
Is there a base station in the Trenton, New Jersey area?
Files can be accessed via the internet at a base station maintained by the New Jersey Department of Transportation in Trenton, NJ.
Metadata
What are metadata?
Metadata or “data about data” document the content, quality, condition and other characteristics of data. In essence, metadata answer who, what, when, where, why and how about the data.
A note on grammar–the word “metadata” is a plural noun, like the word “data.” Therefore, we ask, “what are metadata” rather than “what is metadata.” Likewise, it is grammatically correct to say the “data are” rather than the “data is,” though it is increasingly common to use both terms in a singular context. The academic GIS community most commonly adheres to the plural usage of both terms.
What is the Federal Geographic Data Committee (FGDC) metadata standard and why should we follow this standard?
Online systems for handling metadata need to rely on their metadata being predictable in both form and content. Predictability is assured only by conformance to standards. The standard referred to is the Content Standard for Digital Geospatial Metadata (CSDGM) set by the FGDC. To find this standard and other information about FGDC metadata standards please go to https://www.fgdc.gov/metadata/geospatial-metadata-standards. Metadata files that follow this standard are machine-readable so that they can be searched and parsed.
Why is it important for metadata to be "machine-readable"?
Metadata that are machine-readable can be searched when loaded on a spatial data clearinghouse. A clearinghouse can be used to find spatial data created by other organizations. Because it is expensive and time consuming to create spatial data, it is often useful to share data with other organizations. This system works when organizations create metadata that meet FGDC standards and then submit their metadata to a spatial data clearinghouse. For more information on clearinghouses, see the FGDC Clearinghouse site.
Should I be writing metadata?
If you are a data creator, you should definitely be writing metadata. If your organization creates data, then someone needs to write metadata.
Metadata help people who use geospatial data find the data layers they need and determine how best to use them. Metadata help publicize and support the data you and your organization have produced or modified. It also protects an organization’s investment in data. As personnel change in an organization, undocumented data may lose their value. Furthermore, lack of knowledge about other organizations’ existing data can lead to duplication of effort.
Metadata creation may seem burdensome, but in the long run it’s worth it. Additional examples of the value of metadata are documented by the FGDC. Additional FAQs are available from the USGS.
For GIS Technical Support – Contact BGIS Help Desk GISNET@dep.nj.gov / 609-777-0672