ABOUT GREENHOUSE GASES
What are Greenhouse Gases?
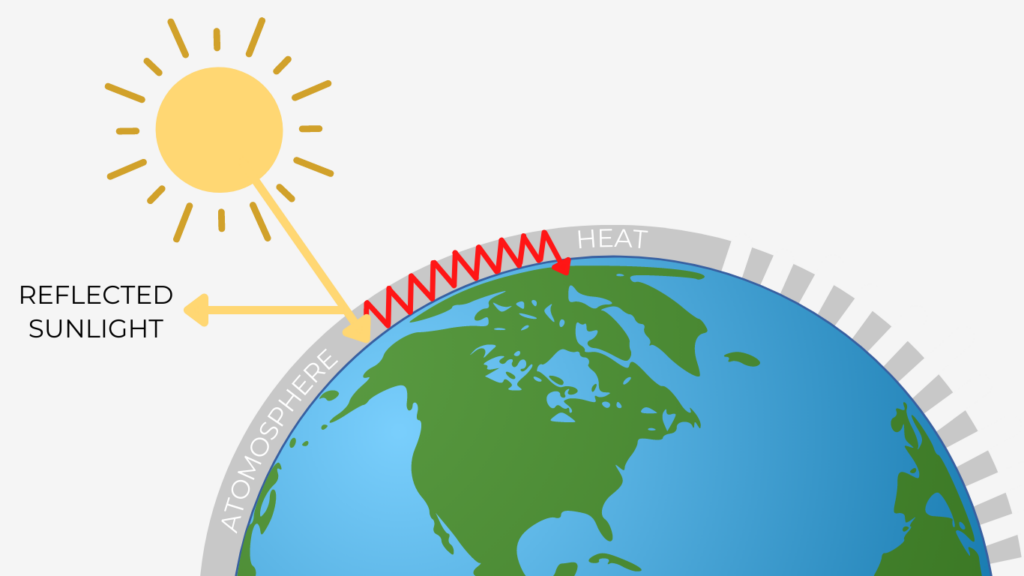
Greenhouse gases trap heat in the Earth’s atmosphere. The gases let sunlight pass through, but they prevent heat from leaving the atmosphere. Naturally occurring greenhouse gases are needed to sustain life on Earth, and are in fact, one of the reasons life on Earth is even possible. However, human activities are emitting greenhouse gas concentrations that are far above what naturally occurs. This has and will continue to drive and accelerate change to the global climate and alter the way humans and all life on Earth will interact and exist on the planet.
Types of Greenhouse Gases

Greenhouse gases (GHGs) are those gases that trap heat in the atmosphere, such as:
- Carbon dioxide (CO2),
- Methane (CH4),
- Nitrous oxide (N2O), and
- Fluorinated gases (hydrofluorocarbons, perfluorocarbons, sulfur hexafluoride, and nitrogen trifluoride).
Except for the fluorinated gases, these gases are emitted from both natural and human activities.
Black Carbon
Another pollutant that contributes to climate change is black carbon (BC), which is not a gas, but is a component of particulate matter. Black carbon forms through the incomplete combustion of fossil fuels, biofuel, and biomass.
Global Warming Potentials
While all greenhouse gases warm the Earth by absorbing energy and slowing the rate at which that energy escapes to space, different greenhouse gases have different effects on the Earth’s warming. Two key ways in which these gases differ from each other are their ability to absorb energy (their radiative efficiency), and how long they stay in the atmosphere (their lifetime).
Global Warming Potential (GWP) allows direct comparisons of the global warming impacts of the different greenhouse gases. Specifically, it’s a measure of how much energy the emissions of 1 ton of a gas will absorb over a given time relative to the emissions of 1 ton of CO2. The larger the GWP, the more that a given greenhouse gas warms the Earth comparted to CO2. The GWP referenced on this page is based on a 100-year scale (GWP100).
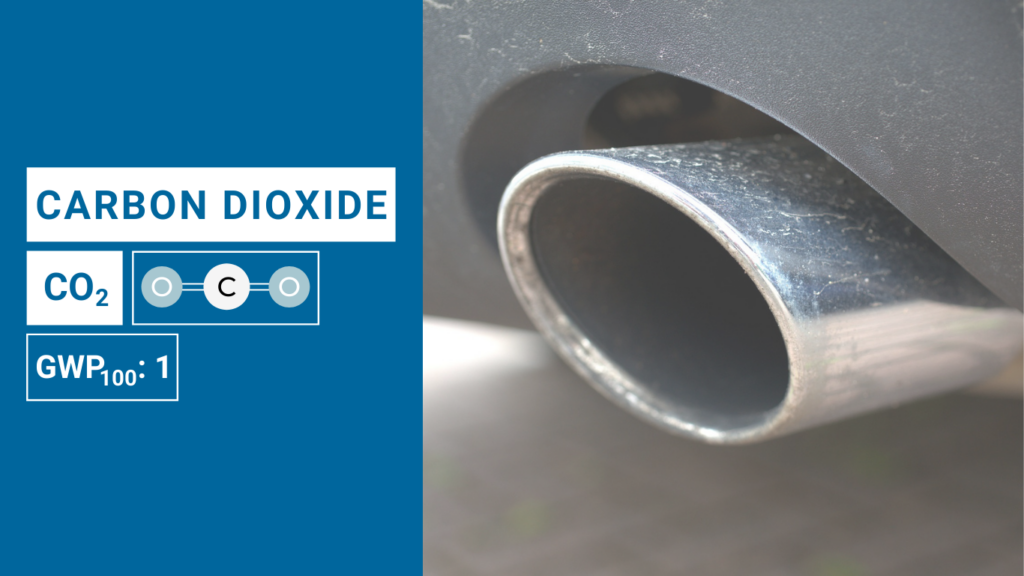
Carbon Dioxide (CO2) is the primary greenhouse gas contributing to climate change. CO2 is naturally present in the atmosphere as part of the global carbon cycle, which is the process of natural circulation of carbon through plant and animal respiration, volcanic eruptions, and ocean-atmosphere exchange.
Atmospheric CO2 concentrations have increased by more than 40% since pre-industrial times, from approximately 280 parts per million by volume (ppmv) in the 18th century to over 400 ppmv in 2015. This has impacted the carbon cycle, affecting the natural cycles that maintain the Earth’s geochemical and biological processes. Human activities currently release over 30 billion tons of CO2 into the atmosphere every year (Hayhoe, K., et al. 2018). The U.S. Geological Survey (USGS) reports that these human-caused emissions are 135 times as much CO2 as volcanoes each year.
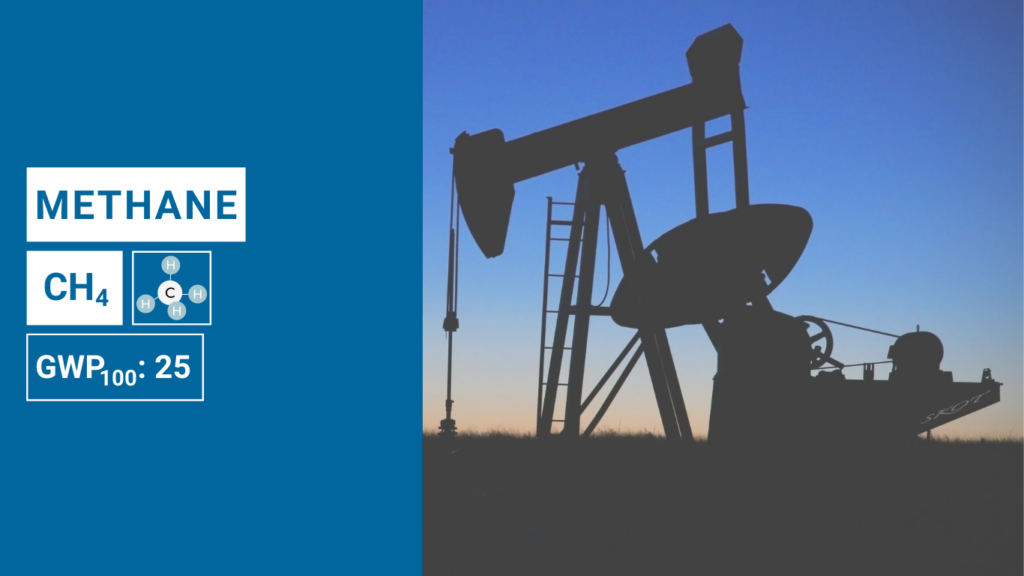
Methane (CH4) is released naturally from wetlands, and through human activities such as industrial, agricultural, land use, and waste management processes. Methane has a far shorter lifespan in the atmosphere than CO2, but it is 25 times more potent in the atmosphere over a 100-year period. Methane is more abundant in Earth’s atmosphere now than at any time in the past 800,000 years (Wolff et al. 2020). Due to human activities, CH4 concentrations increased sharply during most of the 20th century, and are now more than two-and-a-half times pre-industrial levels. In recent decades, the rate of increase has slowed considerably.

Water vapor is the most abundant greenhouse gas, and also the most important in terms of its contribution to the natural greenhouse effect, despite having a short atmospheric lifetime. While some human activities can influence local water vapor levels, on a global scale, the concentration of water vapor is controlled by temperature, which influences overall rates of evaporation and precipitation. Therefore, the global concentration of water vapor is not substantially affected by direct human emissions.
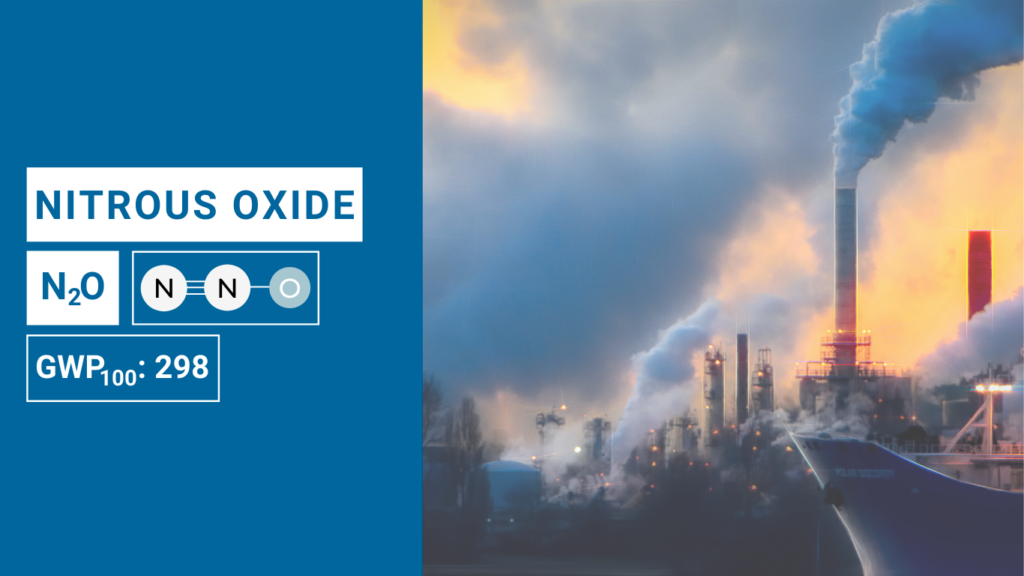
Nitrous oxide (N2O) is a greenhouse gas that is naturally present in the atmosphere as part of the global nitrogen cycle, however human activities such as agriculture, fuel combustion, wastewater management, and industrial processes create higher than average concentrations in the atmosphere. Concentrations of N2O have risen approximately 20% since the start of the Industrial Revolution, with a relatively rapid increase toward the end of the 20th century. Overall, N2O concentrations have increased more rapidly during the past century than at any time in the past 22,000 years (IPCC, 2013).
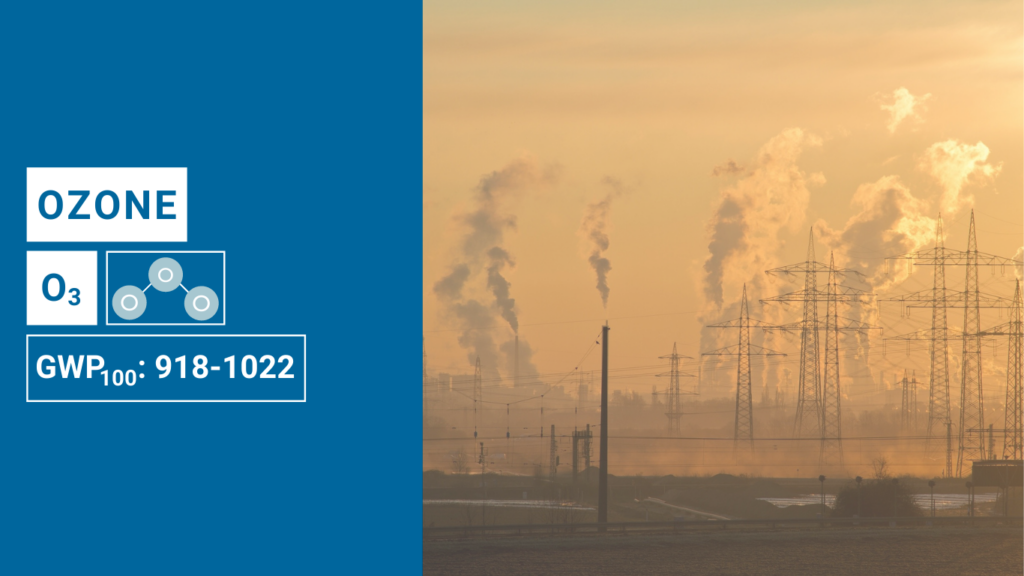
Tropospheric ozone (O3), has a short atmospheric lifetime, and is a potent greenhouse gas. Chemical reactions create ozone from emissions of nitrogen oxides and volatile organic compounds from automobiles, power plants, and other industrial and commercial sources in the presence of sunlight. In addition to trapping heat, ground-level ozone is a pollutant that can cause respiratory health problems and damage crops and ecosystems. Ozone is the only National Ambient Air Quality Standard (NAAQS) that New Jersey has yet to attain. For more information on ozone as an air pollutant, visit http://www.nj.gov/dep/cleanairnj/.

Fluorinated gases such as chlorofluorocarbons (CFCs), hydrochlorofluorocarbons (HCFCs), hydrofluorocarbons (HFCs), perfluorocarbons (PFCs), and sulfur hexafluoride (SF6) are only emitted through human activities. They are often used as substitutes for ozone-depleting substances such as refrigerants, foaming agents, fire extinguishers, solvents, pesticides, and aerosol propellants. They are also used through various industrial processes such as aluminum and semiconductor manufacturing. Unlike water vapor and ozone, fluorinated gases have a long atmospheric lifetime, ranging from 270 years (HFCs) to up to 50,000 years (PFCs), and are only removed from the atmosphere when they are destroyed by sunlight in the far upper atmosphere.

Black Carbon (BC), or soot, is an aerosol component of particulate matter (PM), not a gas. It is formed in varying concentrations with other particulate matter through the incomplete combustion of fossil fuels and biomass burning (Minjares et al. 2014). It contributes to climate warming differently than greenhouse gases, it absorbs sunlight directly and releases heat energy into the atmosphere. Unlike carbon dioxide that remains in the atmosphere for hundreds of years, it is quickly removed by rain and by deposition in a few days or weeks. BC does not remain suspended long enough to mix completely with the atmosphere and as a result, its effects are greatest close to the source.
The Greenhouse Effect
The Greenhouse Effect is a natural process that occurs when the Sun emits intense amounts of solar radiation, or sunlight. The sunlight is either absorbed by the Earth’s surface and atmosphere or is reflected back into space (Wolff et al. 2020). The absorbed sunlight is trapped close to the Earth’s surface by greenhouse gases. This process acts as a blanket for the planet, stabilizing the Earth’s atmosphere and allowing the planet to stay warm enough to sustain life.
The Keeling Curve
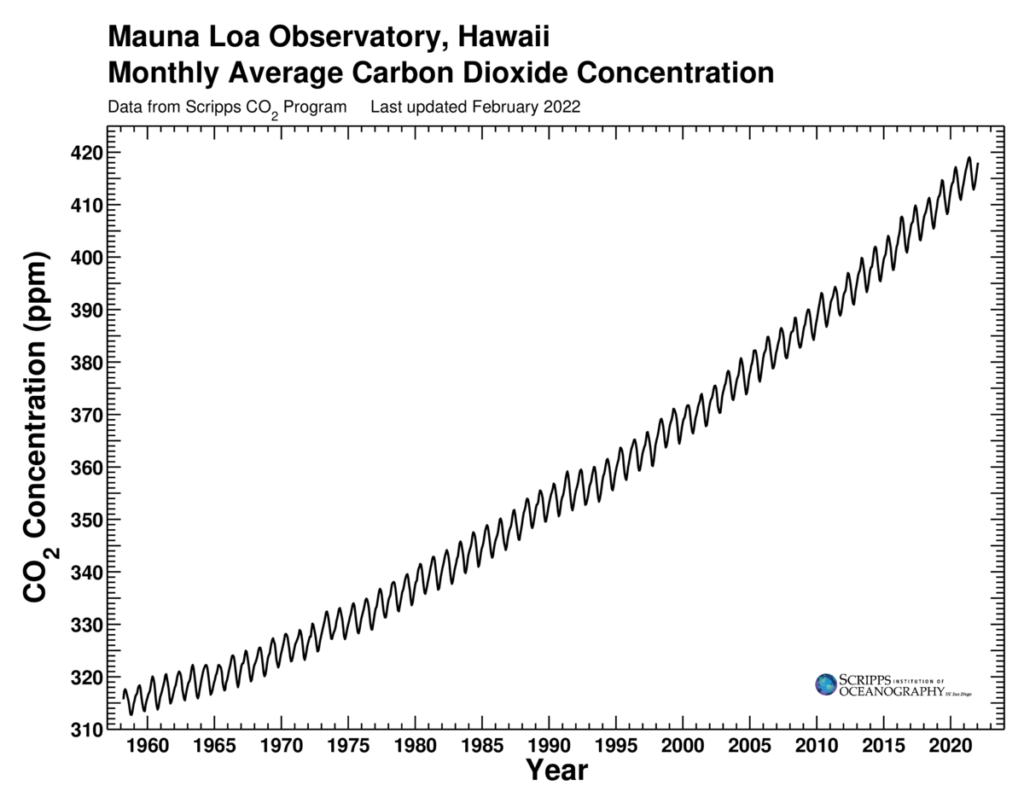
Climate Change is driven by drastic increases in the concentration of greenhouse gases and other climate pollutants that occur in the atmosphere due to human activities. The Keeling Curve is a measurement of the concentration of carbon dioxide in the atmosphere made atop Hawaii’s Mauna Loa since 1958. At the start of the Industrial Revolution, carbon dioxide levels were about 180 parts per million. The average annual carbon dioxide level initially exceeded 400 parts per million in 2016 and continues to rise (Tans and Keeling 2020). An increase in carbon dioxide of this magnitude is expected to result in an unprecedented increase in global temperature. However, exactly how much the average global temperature rises depends how much greenhouse gases are emitted around the globe into the future and how Earth’s climate system responds to this human-induced warming.
See the current Keeling Curve, which is updated daily.
Watch The Museum of Natural History’s video on The Keeling Curve here.
Additional Information
Thank you for your interest in greenhouse gases!
For more information on greenhouse gases in New Jersey and climate impacts, please visit:
References
Hayhoe, K., D. J. Wuebbles, D. R. Easterling, D. W. Fahey, S. Doherty, J. Kossin, W. Sweet, R. Vose, and M. Wehner. 2018. Our changing climate. Pages 72–144 in D. R. Reidmiller, C. W. Avery, D. R. Easterling, K. E. Kunkel, K. L. M. Lewis, T. K. Maycock, and B. C. Stewart, editors. Impacts, Risks, and Adaptation in the United States: Fourth National Climate Assessment, Volume II. U.S. Global Change Research Program, Washington, DC.
IPCC (2013). Climate Change 2013: The Physical Science Basis. Contribution of Working Group I to the Fifth Assessment Report of the Intergovernmental Panel on Climate Change [Stocker, T.F., D. Qin, G.-K. Plattner, M. Tignor, S.K. Allen, J. Boschung, A. Nauels, Y. Xia, V. Bex and P.M. Midgley (eds.)]. Cambridge University Press, Cambridge, United Kingdom and New York, NY, USA.
Minjares, Ray; Wagner, David Vance; Akbar, Sameer. Reducing black carbon emissions from diesel vehicles: impacts, control strategies, and cost-benefit analysis (English). Washington, D.C. : World Bank Group.
Pielou, E. C. 2001. The energy of nature. Pages 1–256. University of Chicago Press, Chicago, IL.
Tans, P., and R. Keeling. 2020. Trends in atmospheric carbon dioxide.
Wolff, E., I. Fung, B. Hoskins, J. F. B. Mitchell, T. Palmer, B. Santer, J. Shepherd, K. Shine, S. Solomon, K. Trenberth, J. Walsh, and D. Wuebbles. 2020. Climate change evidence & causes: Update 2020. Pages 1–24 An overview from the Royal Society and the US National Academy of Sciences. London, UK and Washington, DC.
