GREENHOUSE GAS INVENTORY
Background
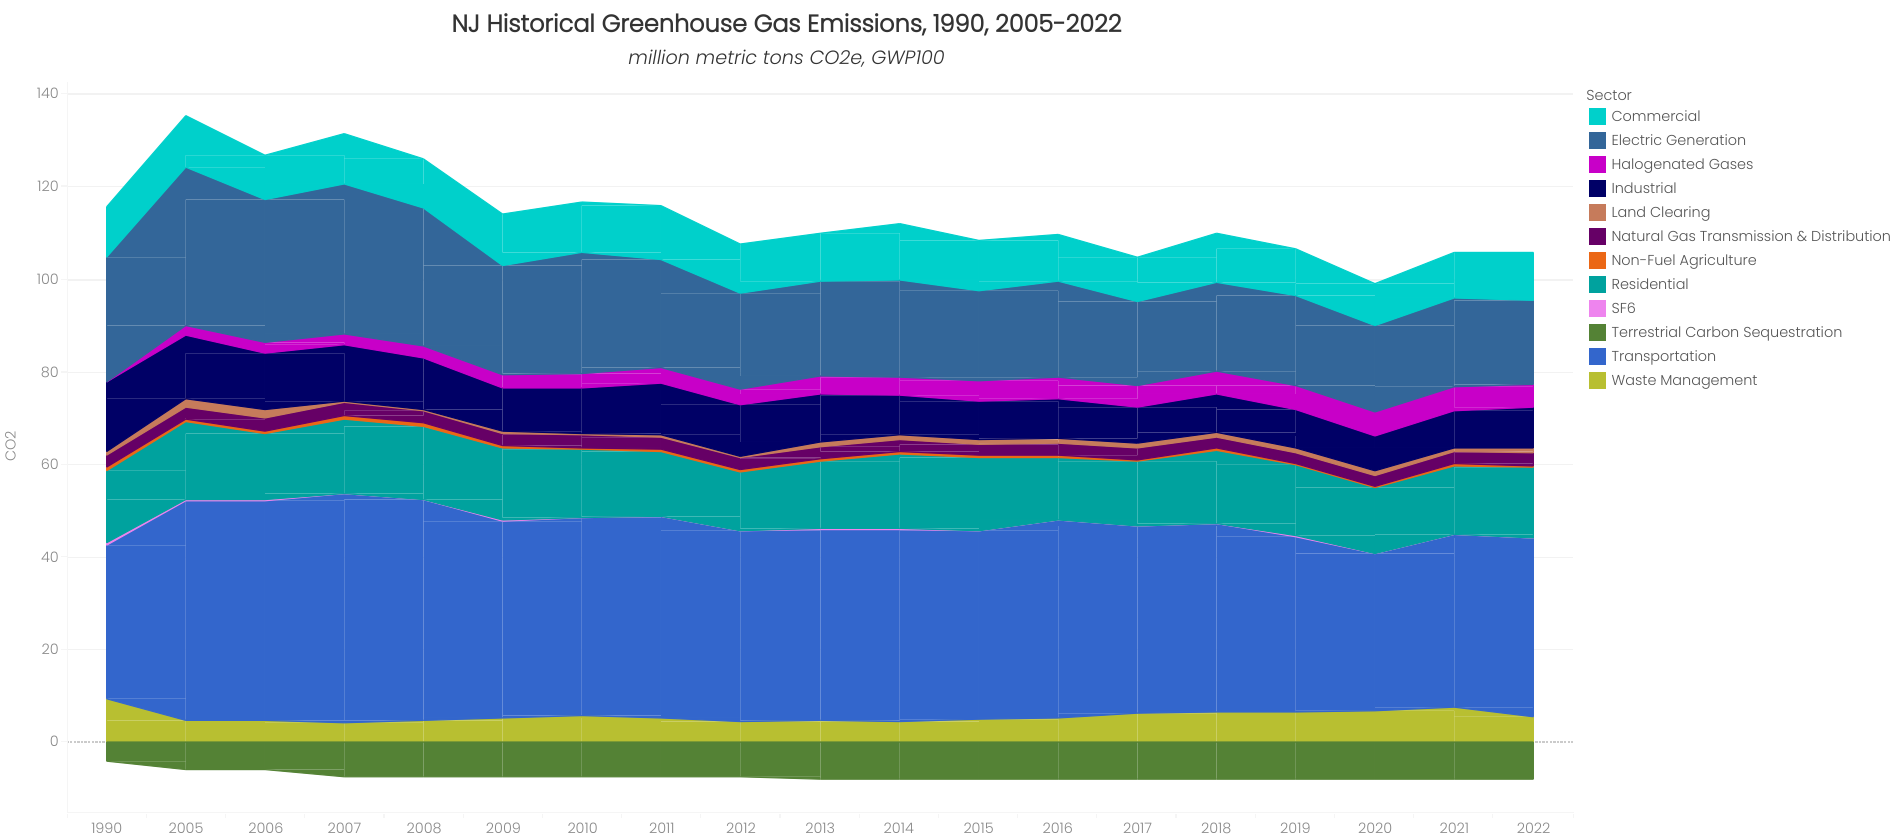
New Jersey’s statewide greenhouse gas (GHG) emissions inventory is a critical tool for tracking progress in reducing GHG emissions. The GHG inventory establishes historical emission trends and demonstrates the state’s progress in achieving its emissions reduction goals, as required by New Jersey’s Global Warming Response Act (GWRA) (P.L. 2007 c.112; P.L. 2019 c.197) and Governor Phil Murphy’s Executive Order 274. The inventory includes estimates for carbon dioxide (CO2), methane (CH4), nitrous oxide (N2O), and fluorinated gases with high global warming potentials, along with estimates for black carbon and carbon sequestration.
The most recent publication from the New Jersey Department of Environmental Protection (NJDEP), is the 2025 Mid-Cycle Update NJ Greenhouse Gas Inventory Report, published in April, which extends emissions estimates to 2022 and includes recalculated emissions for 1990 and 2005 through 2020, applying updated data and methods of analysis. To see previous GHG Inventory Reports, visit the Inventory Archive.
Reporting Framework
Since 2008, the NJDEP has released a comprehensive statewide GHG inventory report approximately every two years. Following the 2019 amendments to the GWRA, the DEP is also committed to releasing data annually to help inform the state’s climate mitigation planning and implementation efforts. The DEP will continue to release a full Emissions Inventory Report every other year and will also provide a “Mid-Cycle Update” during the intervening years. The Emissions Inventory Reports contain detailed analysis, including updated emissions calculations, review of GHG trends, adjustments to baselines (when necessary), and discussion of any changes in emission calculation methodologies. In contrast, the Mid-Cycle Update is a brief summary of the latest emissions data, with concise complementary analysis.
Data Overview
Statewide emission estimates rely on state, local, federal, and international data sources, and facility-specific emission reports from New Jersey’s emission statement program. The current inventory uses 100-year and 20-year global warming potential (GWP) values from the IPCC Fifth Assessment Report, consistent with international and national GHG Inventory practices. In preparation for each new edition of the inventory, recalculations are made to incorporate new methodologies, to reflect changes in data supplied by other agencies and to correct errors. Timeframes for obtaining data extend as long as two years after the end of a given calendar year. In order to provide timely support for mitigation of climate change, when final data is not available New Jersey develops projections based on reference reports and modeling tools provided by the federal government. Later, when final data becomes available, those projections are updated to incorporate the newly released information. Estimates for earlier years may also be revised should the originating source release adjusted figures.
New Jersey's GHG Emissions Inventory Report Purpose
New Jersey Net Greenhouse Gas Emissions in 2022
New Jersey's GHG Emissions Inventory Report Framework
Black Carbon in NJ
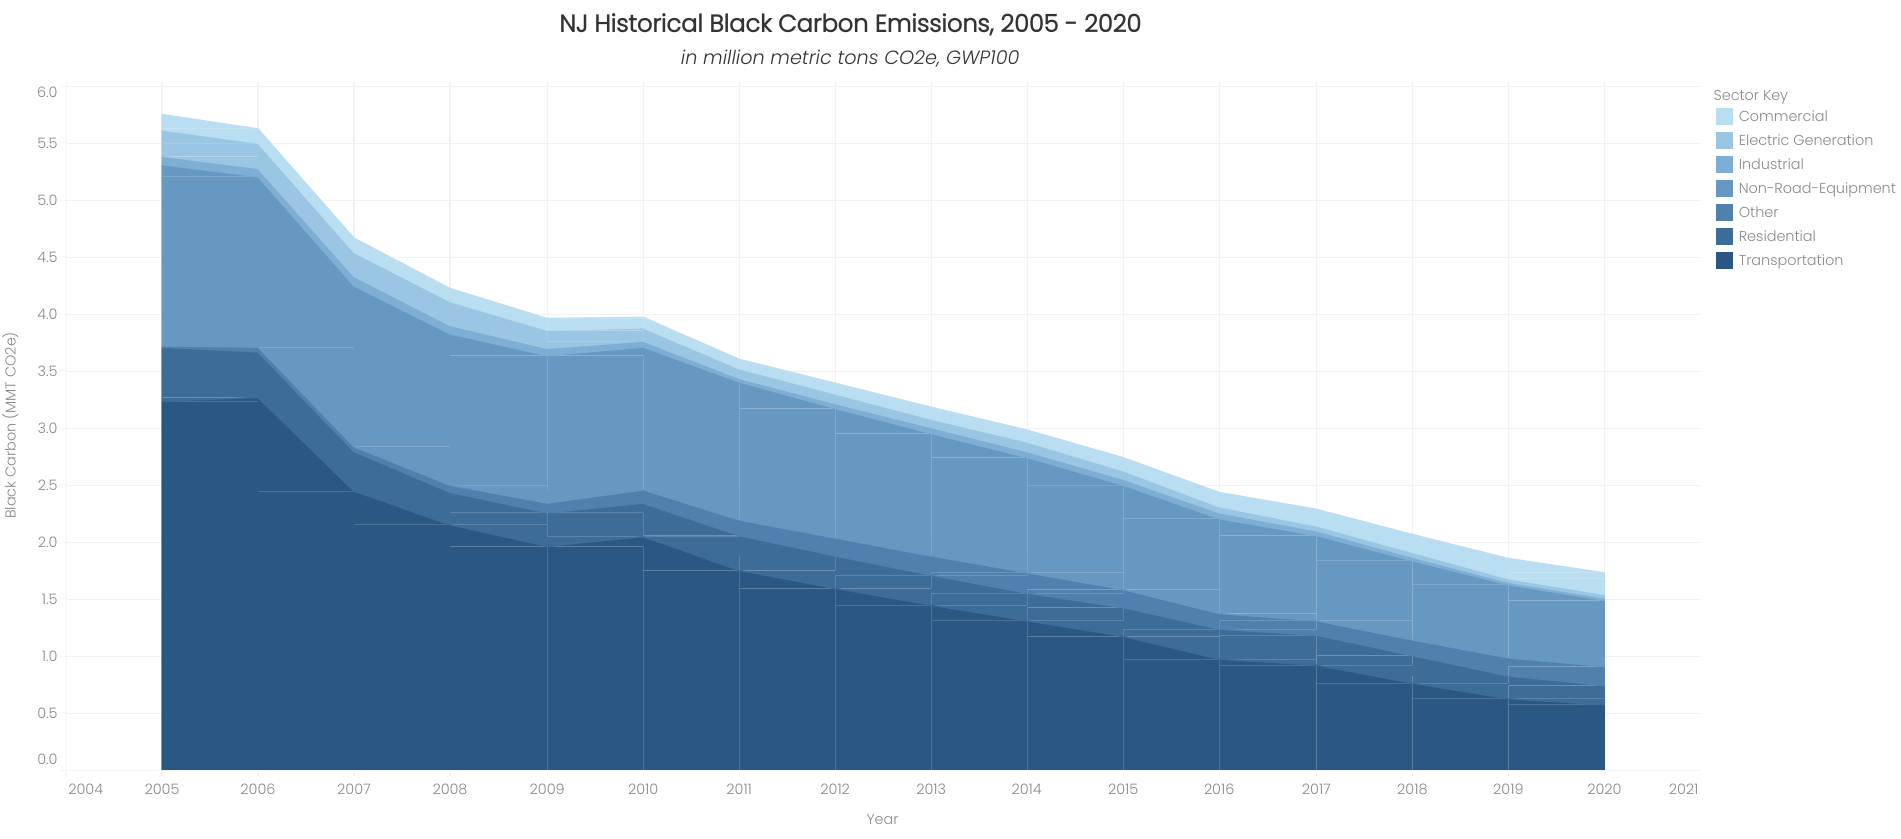
The 2024 Greenhouse Gas Inventory report, summarizes the first comprehensive black carbon inventory for New Jersey, covering years 2005 through 2020. The report found that substantial reductions in black carbon occurred between 2005 and 2020, led by decreases in the two largest sources, transportation, and non-road equipment. The industrial, residential, and electric generation sectors also experienced declines, and the commercial sector (excluding non-road equipment such as forklifts) experienced a small increase.
Below is historical and current data of Black Carbon (BC) in New Jersey, with a sector-specific emissions charts for the baseline year 2005 and most recent data year 2020. All CO2e data is based on GWP100.
To learn more about black carbon, visit the About GHGs page.
Click the image above to view the report
New Jersey Consumption-Based Inventory (2012-2020)
In 2024, the Northeast Waste Management Officials Association (NEWMOA), in collaboration with US EPA, carried out a Consumption-Based Emissions Inventory (CBEI) for eight northeastern states: New Jersey, New York, Connecticut, Rhode Island, Vermont, Massachusetts, New Hampshire, and Maine. This inventory quantified the emissions associated with all final goods consumed within these states, regardless of where the goods were produced geographically. This contrasts with New Jersey’s annual greenhouse gas inventory, which primarily quantifies all emissions generated within the state.
For example, in New Jersey’s annual inventory, the emissions from refining petroleum products made in New Jersey, but sold and utilized in other states would be included in the state inventory. In a consumption-based inventory, the emissions from a petroleum product made in another state or country, but used in New Jersey, would be included.
The Consumption-Based Emissions Inventory evaluated New Jersey’s annual greenhouse gas emissions from 2012 to 2020. For each year in the study, the inventory estimated consumption-based emissions were more than double the emissions estimated in the NJ state inventory. For example, the most recent non-pandemic year (2019), estimated that New Jersey’s emissions were 208.6 metric tons of CO2e compared to 99.5 metric tons of CO2e for the state inventory.
Emissions Rates by State
New Jersey’s wholesale electricity grid is coordinated by Pennsylvania, Jersey, Maryland Power Pool Interconnection, L.L.C. (PJM), a regional transmission organization whose territory also includes all or parts of Delaware, Illinois, Indiana, Kentucky, Maryland, Michigan, North Carolina, Ohio, Pennsylvania, Tennessee, Virginia, West Virginia and the District of Columbia.
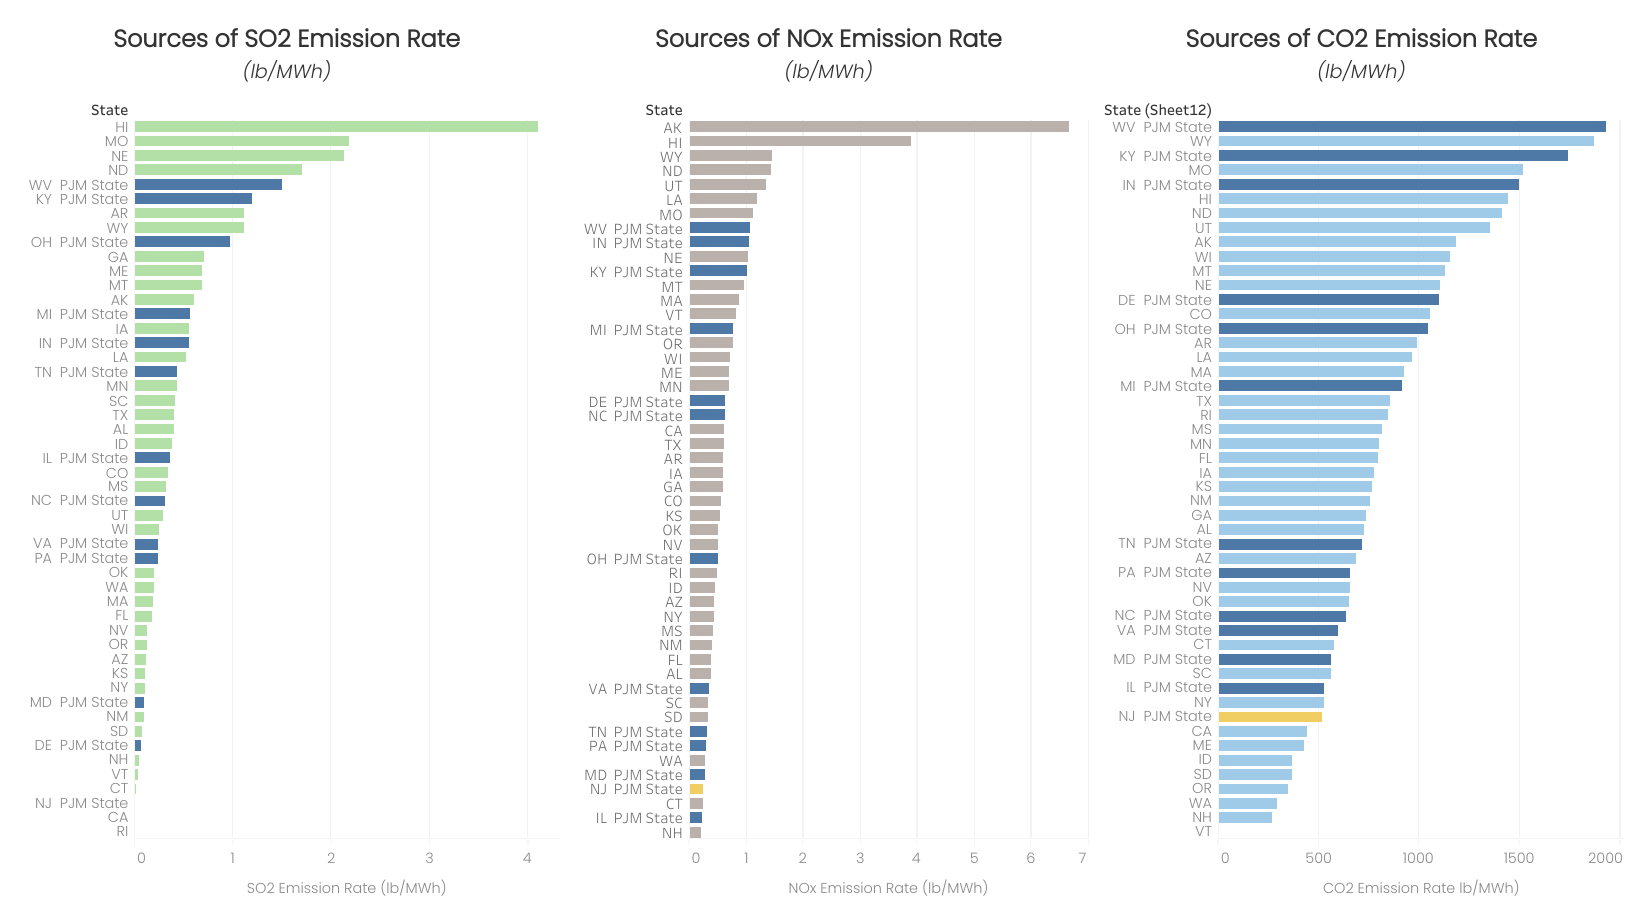
The charts below provide a breakdown of emissions rates of carbon dioxide (CO2), sulfur dioxide (SO2), and nitrogen oxides (NOX) from electricity by state for 2023. Over the years, PJM states have acquired more efficient technologies and new supply resources including including cleaner, more efficient generators, renewables, demand response and energy efficiency, which have brought the annual emissions rates trending downward.
The emissions rates for CO2, SO2, and NOX, measured in pound per megawatt hour (lb/MWh), of all states for the year 2023 are displayed below. The PJM states are identified as dark blue and New Jersey is identified as yellow.
National and Global Trends
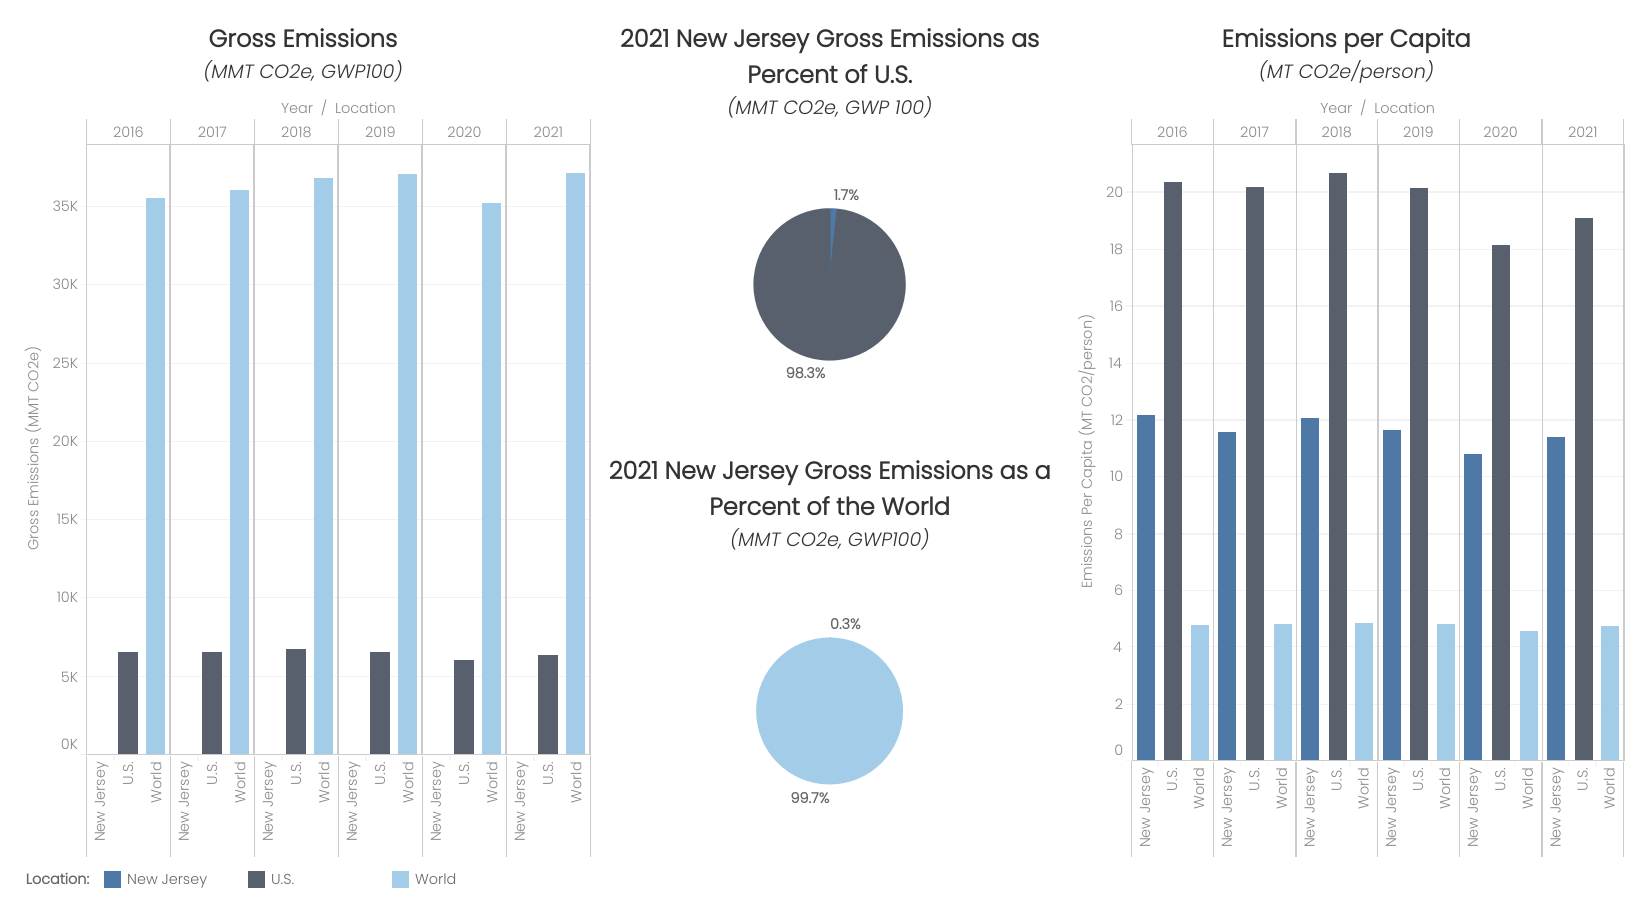
New Jersey’s climate mitigation efforts are only one part of the world-wide response to global warming. Placed in context, New Jersey is responsible for 1.7% of national emissions and 0.3% of worldwide emissions. On a per capita basis, New Jersey in-state emissions ranged between 11 and 12 metric tons CO2e per resident between 2016 and 2021. This was slightly more than half the national average of 20 metric tons per resident, and about double the international average of 5 metric tons per resident.
It should be noted that per capita emissions are based on production-based inventories and are not a reflection of consumption of goods, services and energy in New Jersey.
Click the image above to view the report
