
Camden Waterfront South Air Toxics Pilot Project
The Waterfront South Air Toxics Pilot Project began in the Fall of 2002, when a DEP Workgroup began to make plans to implement a study which was funded by a Community Assessment and Risk Reduction Initiative (CARRI) Grant provided to the DEP by the USEPA. This pilot project was designed to develop tools that can be used to quickly assesss air quality (especially air toxics) problems in a community. The focus of the project was on 1) air toxics, which are harmful substances such as arsenic, lead, and cadmium that can come from industrial or manufacturing sources; and 2) particulate matter (PM), which is tiny liquid or solid particles such as dust, smoke, mist, or fumes. These pollutants can cause a wide variety of health effects, including breathing difficulties, learning disabilities and cancer.
The Waterfront South neighborhood of Camden was designated as the study area in part because of the many air quality concerns that had been raised by the residents. This project provided a means to quantify the impact of the numerous sources located in this neighborhood (which covers less than one square mile) including the Camden County Sewage Treatment plant, the County Municipal Waste Combustor, the world’s largest licorice processing plant, and a cement manufacturing facility. During the course of the project the DEP worked with a Community Advisory Committee composed of residents and professionals who work in the neighborhood. The Committee helped to ensure that all critical air emission sources were identified for inclusion in the study. They also assisted in identifying risk reduction strategies to address the pollutants of concern which were flagged in the risk assessment.
- Finding the sources of air toxics and particulate matter in and around the Waterfront South neighborhood.
- Collecting detailed information about the air pollution sources, including the type and quantity of pollution they produce.
- Identifying the air toxics and particulates that pose the greatest health risks to people who live in the neighborhood, and highlighting the sources of those pollutants.
- Collecting ambient air monitoring data to further assess the levels of pollution found in the neighborhood.
- Identifying strategies to reduce the health risks.
EMISSION INVENTORY & DISPERSION MODELING
Information on air emissions was collected on a very fine scale, beginning with what was known about emissions from air pollution permits, and then filling in many details about the sources that could not be gleaned from permits by tapping into other databases and visiting each facility. Information on emissions of about 40 pollutants from over 25 facilities was collected into what is known as an emission inventory (described in Section 2.1 of the report). The inventory data were then used with a dispersion model to predict concentrations of these pollutants in the air throughout the neighborhood on a very fine grid (see Section 2.2 of the reprot). The results of the model runs, which represent worst-case conditions, were analyzed in the risk assessment.


RISK ASSESSMENT
Potential health risk for this project was estimated by calculating risk ratios, a comparison of an air concentration to a health benchmark. If the air concentration is higher than the benchmark (resulting in a ratio greater than 1), there is a concern that the exposure could result in some detrimental health effect. Use of a risk ratio to evaluate results is different from the approach commonly used to evaluate carcinogens. In this study, instead of reporting risk (for example one in a million cancer risk or one in ten thousand risk) which can give the impression that the precise level of risk has been calculated, we have used risk ratios to tell us if the predicted levels are above or below a critical threshold (the health benchmark). A similar approach is used here for noncarcinogenic substances. Using this approach, pollutants that fall above the health benchmark (i.e. having risk ratio greater than one) warrant additional study. Those that fall below the health benchmark are set aside. This method is outlined in Section 2.3 of the report.
Using this risk ratio approach, seven toxic air pollutants and two forms of particulate matter were predicted to have risk ratios greater than one, from which was drawn the general conclusion that Waterfront South is an area with relatively high particulate levels; and that some of this particulate matter contains significant quantities of toxic metals, such as arsenic, cadmium, lead, manganese and nickel. It is expected that this will be a
common finding as the DEP investigates exposure to multiple air pollution sources in other urban neighborhoods around the state.
Further review of the modeling results revealed that the relatively high air concentrations (flagged by the risk assessment) can be attributed to emissions from ten different facilities in and near Waterfront South. As part of this study, the emissions of these nine pollutants from the ten facilities received additional scrutiny.
AIR MONITORING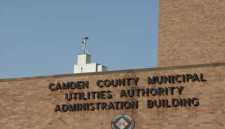
At the same time that the modeling and risk assessment steps were being carried out, a limited amount of ambient air monitoring was also initiated to further assess the levels of pollution found in the neighborhood. Three monitoring efforts were carried out as part of this project. They included 1) installation of a continuous monitor for fine particulate on the roof of the CCMUA (see photo, right); 2) grab samples of air which were analyzed for a suite of air toxics using tedlar bags contained in buckets (i.e. the Bucket Brigade); and 3) specialized canister and open-path sampling for air toxics at the Camden County sewage treatment facility. The methods and results are described in Section 2.4 of this report.
RISK REDUCTION STRATEGIES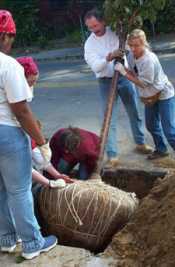
The final step in the pilot project was to identify a list of potential Risk Reduction Strategies (see Section 2.5 of the report). These are actions which could help to reduce exposure to particulate matter and air toxics in Waterfront South. The list of risk Reduction Strategies falls into four categories: Stationary Source Emission Reductions; Truck Emission Reductions; Environmental Health Education; and Vegetation for Dust Suppression. These actions span many programs in the DEP and even reach into other agencies.
REDUCING AIR EMISSIONS IN WATERFRONT SOUTH
Although it was not an official part of the project, some actions have already been taken to implement several of these risk reduction strategies. For example, the facility with the highest predicted particulate impacts has installed new particulate control equipment (a bag house) and another facility which was sandblasting outdoors has moved the operation indoors. An inter-local service agreement between the City and the County has resulted in a truck prohibition on a residential portion of Ferry Avenue. And the County Health Department anti-idling campaign has significantly reduced idling of trucks along Morgan Boulevard and in other areas. These actions are described briefly in Section 2.5 of this report.