In This Report:
Contact Us:
Environmental Trends Report
NJDEP, Division of Science and Research
Groundwater Quality
Ambient Groundwater Quality Monitoring Network
Background
Understanding the quality of shallow groundwater is important because it is the water that typically recharges deeper aquifers and provides base flow to local streams and wetlands. The NJDEP, in partnership with the U.S. Geological Survey (USGS), monitors groundwater quality with its New Jersey Ambient Groundwater Quality Monitoring Network (AGWQMN). The goals of the AGWQMN are to assess groundwater quality status and trends, evaluate contaminant sources, and identify emerging water quality issues.1
The network consists of 150 shallow monitoring wells that were sampled historically at the rate of 30 wells per year on a five-year cycle beginning in 1999. The sampling frequency increased to once every three years starting with the fourth sampling cycle in 2014.1 The wells cover a range of the State’s geology and land-use patterns. Chemical and physical parameters analyzed in each groundwater sample include pH, total dissolved solids, dissolved oxygen, temperature, alkalinity, major ions, trace elements, nutrients, gross-alpha particle activity, volatile organic compounds (VOCs), and pesticides. Network wells are screened approximately five feet below the water table, so the sample water is therefore expected to be relatively young groundwater. Monitoring younger groundwater, rather than the older groundwater in deeper systems, permits a better assessment of how current land-use activities are affecting groundwater quality.
Six sampling cycles have been completed to date. The first sampling cycle was performed between 1999 and 2003, the second sampling cycle was performed between 2004 and 2008, and the third between 2009 and 2013. The fourth sampling cycle occurred between 2014 and 2016, and the fifth sampling cycle was performed between 2017 and 2019. The sixth sampling cycle began in 2020, but the full laboratory results are not yet available.
Well locations, along with the corresponding geology and land-use category, are depicted in Figure 1. Two generalized physiographic provinces cover the State, designated as the bedrock (BR) region and Coastal Plain (CP) region. The sampling sites were selected in both provinces to cover three primary land-use designations, namely undeveloped (UND), agricultural (AG), and urban (URB). The distribution of wells as a function of land use is 30 in UND land-use areas, 60 in AG areas, and 60 in URB areas.1 Land-use designations were determined using 1986 and 1995 land-use/land-cover datasets, site visits, and estimations of groundwater flow directions (based on the local geologic framework and site-specific topographic controls) to ensure each well is down-gradient of the desired land use.1,2
There are subtle differences in natural groundwater quality between northern and southern New Jersey. Groundwater in northern New Jersey tends to have a more neutral to basic pH, due in part to that region’s bedrock geology. The concentrations of calcium, magnesium, sodium, potassium, chloride, sulfate, fluoride, and silica ions are generally higher in the northern part of the State than in the southern part due to the regional geology. The groundwater in the southern part of the State generally has a more acidic pH and lower total dissolved solids (TDS) levels, which is also reflective of the regional geology.1 Anthropogenic activities, such as the application of road salt and lawn care and agricultural chemicals, contribute to higher TDS and ion levels in agricultural and urban land-use areas.1
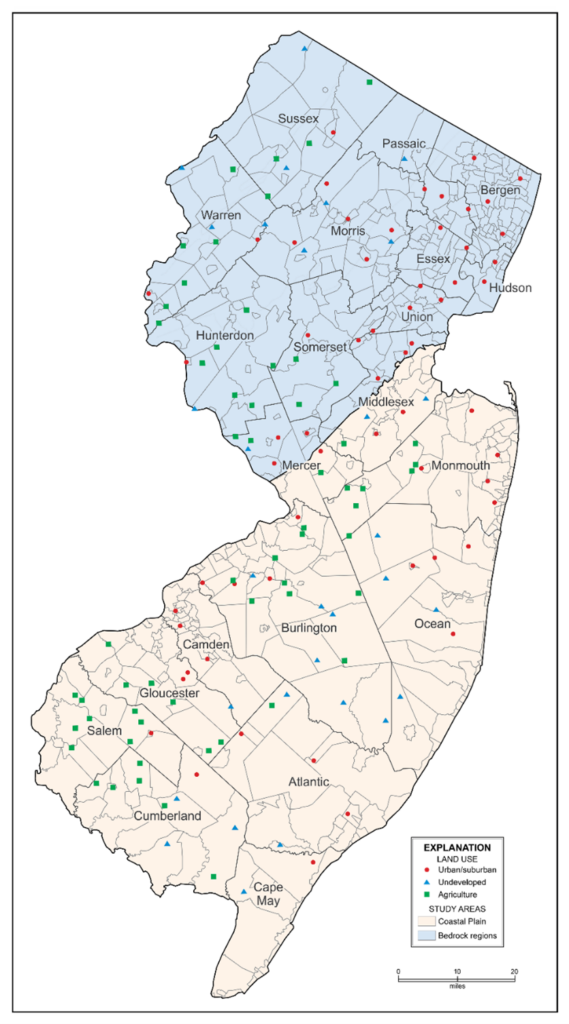
Figure 1. Ambient Ground Water Quality Monitoring Network Locations with land-use and location designations.
Status and Trends
Trends in chloride, sodium, and nitrate-nitrite concentrations, as well as the occurrence of VOCs, over the five sampling cycles are presented below. The trends are evaluated for sites in the northern and southern parts of the State separately due to the differences in regional geologies. The influence of land use on major ions and nutrients, including those presented below, is discussed in a New Jersey Geological and Water Survey report.1
Chloride
The NJ Ground Water Quality Criterion (GWQC) for chloride is 250 mg/L.3 During sampling cycle 5, chloride concentrations in groundwater exceeded the GWQC for 22% of the samples in the bedrock region and for 21% of the samples in the Coastal Plain region. There were no statistically significant differences in chloride concentrations in groundwater over the sampling cycles for the bedrock region4 (Figure 2A). However, during cycle 4 in the Coastal Plain region5, chloride was significantly higher than during the other cycles (Figure 2B). The 30 undeveloped land use wells were not sampled in cycle 4. The undeveloped land use wells generally have lower chloride concentrations, so their absence from the analysis likely contributed to higher median chloride concentrations observed for cycle 4 in the Coastal Plain.
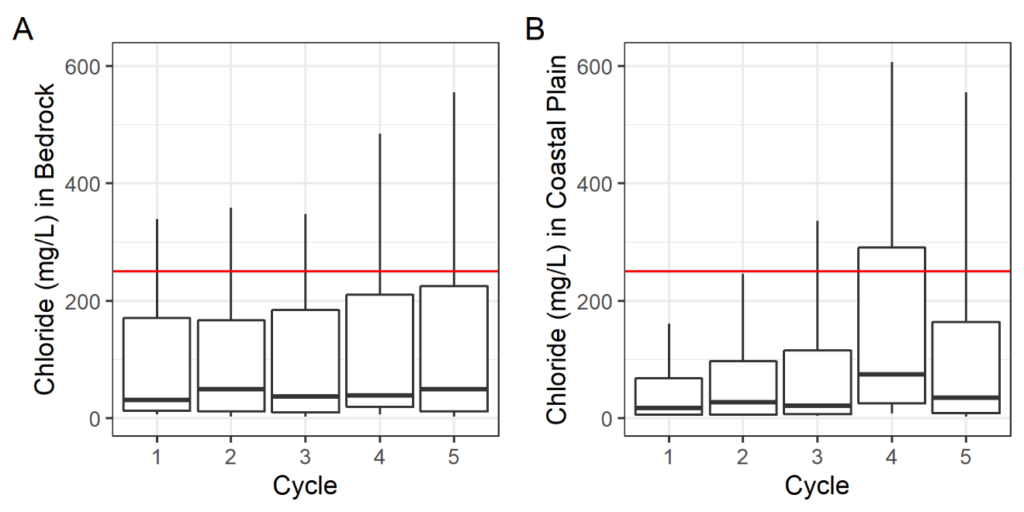
Figure 2A–B. Chloride concentrations (mg/L) in ground water by sampling cycle for the bedrock physiographic region (A) and Coastal Plain physiographic region (B). The boxplot shows the 10th, 25th, median, 75th and the 90th percentiles. The red horizontal line represents the NJ Ground Water Quality Criterion (GWQC) for chloride of 250 mg/L. It should be noted that the 30 undeveloped land use wells were not sampled in cycle 4.
Sodium
The NJ Ground Water Quality Criterion for sodium is 50 mg/L.3 During sampling cycle 5, sodium concentrations in groundwater exceeded the GWQC for 31% of the samples in the bedrock region and for 28% of the samples in the coastal plain region. There were no statistically significant differences in sodium concentrations in groundwater over the sampling cycles for the bedrock region6 (Figure 3A), however in the Coastal Plain region7 sodium was higher in cycle 4 than in cycles 1,2, 3, and 5 (Figure 3B). The 30 undeveloped land use wells were not sampled in cycle 4. The undeveloped land use wells generally have lower sodium concentrations, so the absence of data from the undeveloped land use wells located in the Coastal Plain likely contributed to higher median sodium concentration observed for cycle 4.
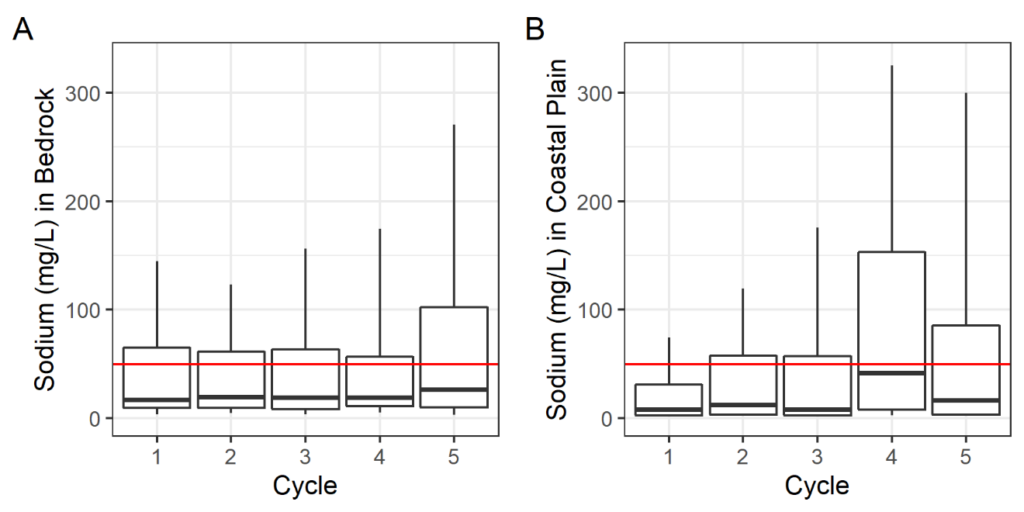
Figure 3A–B. Sodium concentrations (mg/L) in ground water by sampling cycle for the bedrock region (A) and Coastal Plain region (B). The boxplot shows the 10th, 25th, median, 75th, and the 90th percentiles. The red horizontal line represents the NJ Ground Water Quality Criterion (GWQC) for sodium of 50 mg/L. It should be noted that the 30 undeveloped land use wells were not sampled in cycle 4.
Nitrate-Nitrite
Nitrate plus nitrite measured as nitrogen (nitrate-nitrite) is one of the most widely spread groundwater contaminants found across the Northern Atlantic Coastal Plain Surficial Aquifer System.8 Potential sources in groundwater include fertilizers and manure management,9 as well as septic systems and leaking sewer systems. The NJ Ground Water Quality Criterion for nitrate is 10 mg/L.3 During sampling cycle 5, nitrate-nitrite concentrations in groundwater exceeded the GWQC for approximately 5% of the samples in the bedrock region and for approximately 11% of the samples in the Coastal Plain region. There were no statistically significant differences in nitrate-nitrite concentrations in groundwater over the sampling cycles for either the bedrock region10(Figure 4A) or the Coastal Plain region11 (Figure 4B). It should be noted that the 30 undeveloped land use wells were not sampled in cycle 4. Because some of the results were below the laboratory reporting limit (i.e., non-detect or censored values), Kaplan-Meier survival analysis12 was applied to the nitrate-nitrite dataset rather than substituting or setting values below the reporting limit.
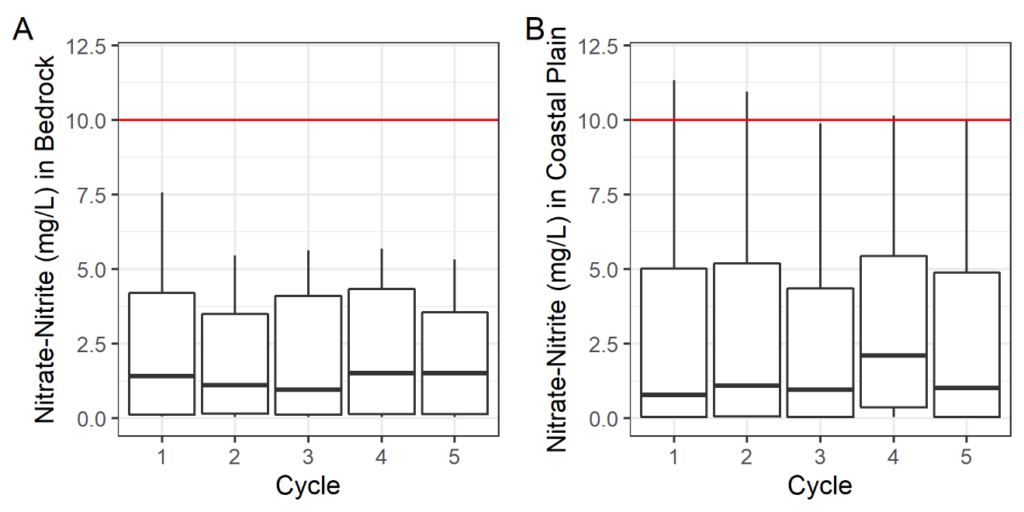
Figure 4A–B. Nitrate-nitrite concentrations (mg/L) in ground water for the bedrock region (A) and Coastal Plain region (B). The boxplot shows the 10th, 25th, median, 75th, and the 90th percentiles. The red horizontal line represents the NJ Ground Water Quality Criterion (GWQC) for nitrate of 10 mg/L. It should be noted that the 30 undeveloped land use wells were not sampled in cycle 4.
Pesticides
Although not shown graphically in this report, pesticide concentrations in groundwater were evaluated as part of the AGWQMN. During cycle 3, a number of pesticide metabolites were added to the analyte list, and this analyte list was maintained through cycles 4 and 5. Statewide, the number of monitoring wells that had detections of one or more pesticides remained consistent between sampling cycles 1 and 2 (74 of 148 (50%) wells and 75 of 150 (50%) wells, respectively). The frequency of pesticide or pesticide metabolite detections increased in cycle 3 to 90 of 121 (74%) monitoring wells (most undeveloped land use wells were not sampled for pesticides in cycle 3), but this increase may be due to the expansion of the analyte list. In cycle 4, 71 of the 120 (59%) monitoring wells sampled that cycle had detections of pesticides. The 30 undeveloped land use wells were not sampled during cycle 4. In cycle 5, 76 of the 149 (51%) monitoring wells had detections of pesticides. In cycle 5, the most common pesticide compounds observed were the herbicides atrazine, deethylatrazine, metolachlor, prometon, and simazine.
Volatile Organic Compounds
The groundwater samples were analyzed for 35 VOCs. The frequency of VOC detection is a function of land use. Figure 5 shows the percentage of monitoring wells per sampling cycle that had at least one VOC detection. In previous iterations of this report, a graph with total VOC concentrations for each sampling cycle was displayed, but it was replaced by Figure 5 to better illustrate the change over time by land use. Of the three land uses, the samples from the urban land use monitoring wells generally had the highest frequency of detection of VOCs. It should be noted that a high percentage of undeveloped wells in the Coastal Plain had detections for one compound, trichloromethane (chloroform). Aside from these detections, the frequency of VOC detection in undeveloped land use areas is relatively low.
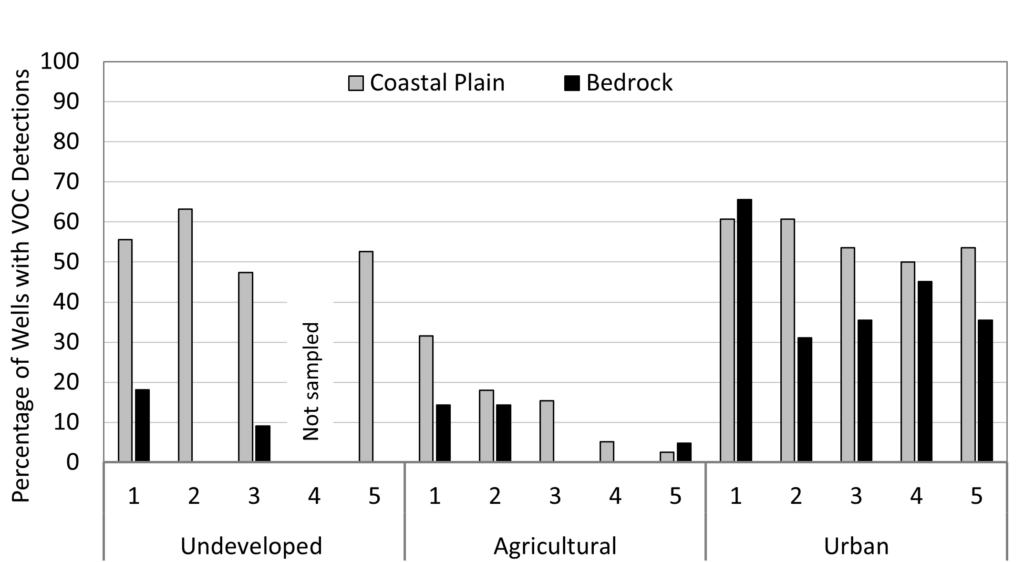
Figure 5. Frequency of Volatile Organic Compounds (VOC) detection by land use and sampling cycle.
The most widely detected VOC in the network is trichloromethane and detections of trichloromethane appear to have remained relatively stable over the sampling cycles (Figure 6). New Jersey’s high frequency of detection of trichloromethane is consistent with national studies conducted by the USGS, which found chloroform to be the most frequently detected VOC in both public and domestic wells.13,14 Natural sources of chloroform include volcanic gases, marine algae, and soil fungi.14 Anthropogenic sources of chloroform in the environment include air emissions, past production of CFCs, and chlorination of water for disinfection purposes.14
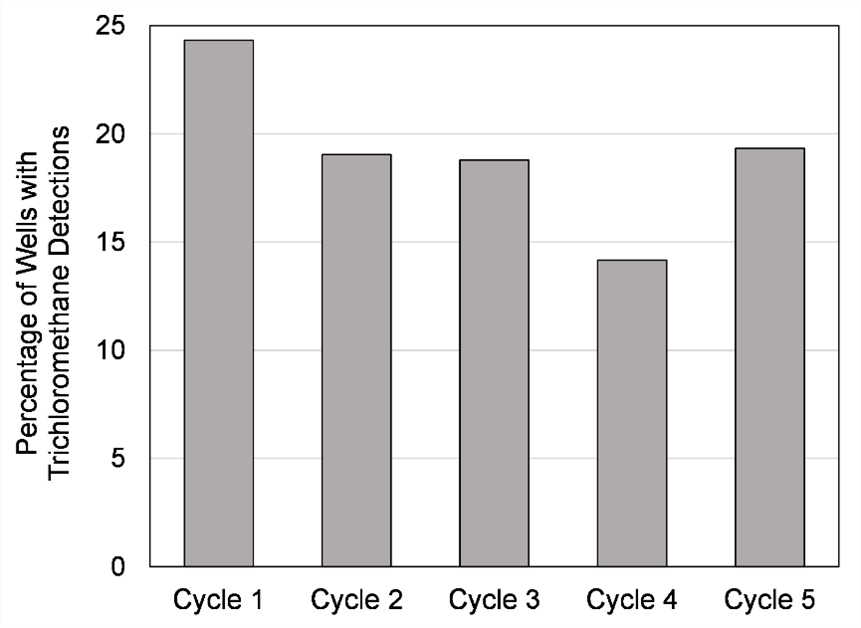
Figure 6. Percentage of monitoring wells with trichloromethane (chloroform) concentrations in groundwater above the reporting limit (*reporting limit varied from 0.03–1 µg/L). The 30 undeveloped land use wells were not sampled in cycle 4.
Other VOCs that are sometimes detected in New Jersey’s AGWQMN include tetrachloroethene (PCE), trichloroethene (TCE), and methyl tertiary-butyl ether (MTBE.) Similar to chloroform, these constituents are frequently detected in groundwater on a national level.13 There were select instances when wells exceeded the Ground Water Quality Criteria (Class IIA) for individual contaminants. Methyl tertiary-butyl ether (MTBE), an additive in gasoline, showed a steep decline in the frequency of detection, especially in the bedrock provinces after sampling cycle 1 (Figure 7). The decrease in detections of MTBE is likely attributable to a ban on using MTBE in the State of New Jersey passed in 2005 that required MTBE to be phased out by 2008.
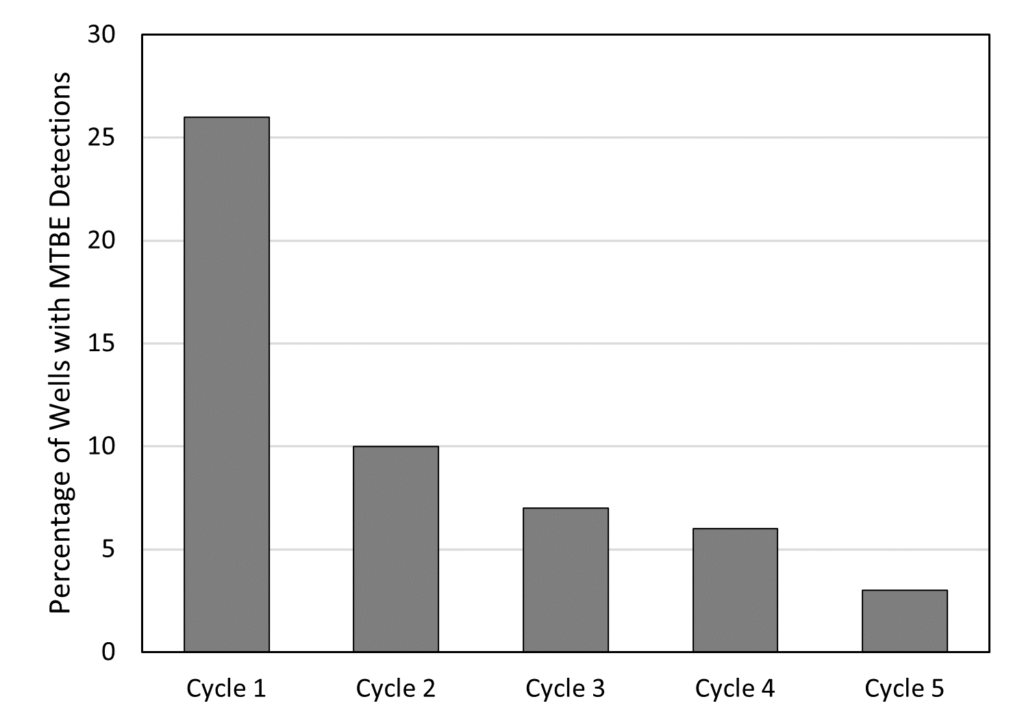
Figure 7. Percentage of monitoring wells with methyl tertiary-butyl ether (MTBE) concentrations in ground water above the reporting limit (reporting limit varied from 0.1–0.85 µg/L). The 30 undeveloped land use monitoring wells were not sampled in cycle 4.
Outlook and Implications
The AGWQMN was designed to cover the entire State to assess ambient groundwater conditions and land use impacts. Anthropogenic activities are known to impact shallow groundwater quality, and protecting this resource is critical to protecting environmental and human health as approximately 30% of the drinking water supply in New Jersey is derived from groundwater (see NJDEP Environmental Trends Report on Water Supply ). New parameters (e.g., PFAS beginning in cycle 6) have been and will continue to be added to the network as appropriate.
The groundwater quality data from the AGWQMN have numerous uses. The data are used to help set groundwater rules and/or standards within the State and to assess groundwater quality in various geological formations. It provides data to assist external agencies, such as the USGS, to evaluate groundwater quality on a regional scale. The New Jersey AGWQMN was one of the first networks to provide data to the USGS National Ground-Water Monitoring Network. Licensed Site Remediation Professionals (LSRPs) also use the data to estimate background water-quality conditions. The AGWQMN data provide insight for policy makers to assess current groundwater-quality policies and to help shape future policies.
References
1Bousenberry, R., New Jersey Geological and Water Survey, New Jersey Department of Environmental Protection. 2016 (revised). Information Circular, New Jersey Ambient Ground Water Quality Monitoring Network: New Jersey Shallow Ground-Water Quality, 1999-2008. Available at https://www.nj.gov/dep/njgs/enviroed/infocirc/NJAGWQMN.pdf
2Scott, J.C. 1990. Computerized stratified random site-selection approaches for design of a ground-water-quality sampling network, U.S. Geological Survey, WRI Report 90-4101.
3N.J.A.C. 7:9C, Ground Water Quality Standards, readopted without change on March 4, 2014 (see April 7,2014 New Jersey Register).
4Kruskal-Wallis test χ2 = 1.12, df = 4, p-value > 0.05.
5Kruskal-Wallis test χ2 = 24.17, df = 4, p-value < 0.001.
6Kruskal-Wallis test χ2 = 0.98, df = 4, p-value > 0.05.
7Kruskal-Wallis test χ2 = 21.36, df = 4, p-value < 0. 001 .
8Denver, J.M., Ator, S.W., Fischer, J.M., Harned, D.C., Schubert, C., and Szabo, Z. 2014. The Quality of Our Nation’s Waters—Water Quality in the Northern Atlantic Coastal Plain Surficial Aquifer System, Delaware, Maryland, New Jersey, New York, North Carolina, and Virginia, 1988–2009: U.S. Geological Survey Circular 1353, 88 p.
9Puckett, Larry J., Tesoriero, Anthony J., Dubrovsky, Neil M. 2011. Nitrogen Contamination of Surficial Aquifers-A Growing Legacy, Environmental Science and Technology,45, p. 839-844.
10Wilcoxon Peto-Prentice test χ2 = 0.1, df = 4, p-value > 0.05.
11Wilcoxon Peto-Prentice test χ2 = 0.1, df = 4, p-value > 0.05.
12Helsel, D. R. 2012. Statistics for Censored Environmental Data Using Minitab and R, Second Edition. John Wiley & Sons, Inc., Hoboken, New Jersey.
13Zogorski, J.S., Carter, J.M., Ivahnenko, T., Lapham, W.W., Moran, M. J., Rowe, B.L., Squillace, P.J., and Toccalino, P.L. 2006. The quality of our Nation’s water—Volatile organic compounds in the Nation’s ground water and drinking-water supply wells: U.S. Geological Survey Circular 1292, 101 p.
14Ivahnenko, T., and Zogorski, J.S. 2006. Sources and occurrence of chloroform and other trihalomethanes in drinking-water supply wells in the United States, 1986–2001: U.S. Geological Survey Scientific Investigations Report 2006–5015, 13 p.