In This Report:
Other Links
Contact Us:
Environmental Trends Report
NJDEP, Division of Science and Research

Fish: Concentrations of Key Contaminants
Background
Fish are an excellent source of protein, minerals, and vitamins, are low in fat and cholesterol, and play an important role in maintaining a healthy, well-balanced diet. However, certain fish may absorb toxic chemicals, such as polychlorinated biphenyls (PCBs), mercury, and per- and polyfluoroalkyl substances (PFAS), from the water they live in and the food they eat. Chemical contaminants such as dioxin and PCBs are classified by the U.S. Environmental Protection Agency as probable cancer-causing substances in humans. Elevated levels of mercury can pose serious health risks to the human nervous system, particularly to developing fetuses, and some PFAS can cause health effects including suppression of the immune system, developmental delays, increased cholesterol, liver toxicity, and/or increased cancer risk.
Since 1982, when research began to show elevated levels of these potentially harmful chemical contaminants in certain fish and crabs in some New Jersey waters, fish-consumption advisories have been issued to protect, inform and guide citizens on how to safely eat fish. The fish consumption advisories are developed through a scientific process that includes collecting samples of fish from waters throughout the state and analyzing them for various chemical contaminants. The contaminant levels in the fish are then evaluated using both state and federal guidelines for protecting human health. Based upon those findings, advice on fish consumption is then developed for the general public as well as that part of the population that may be at higher risk such as pregnant women and children. In addition, since levels of contaminants vary between species and location, the consumption advisories are also issued for specific species from individual water bodies when data are available.
In 2002, to update and revise the State’s fish consumption advisories, the Toxics in Biota routine monitoring program was developed and implemented by the DEP to assess toxics in fish and other species (e.g., crabs). This comprehensive program follows a monitoring protocol that divides the State’s waters into five regions (Raritan, Atlantic, Lower Delaware, Northwest, and Northeast) that are sampled on a rotating basis. Methodology for assessing fish from coastal waters is also included when data are available. The first round of this monitoring program containing five regions was completed in 2013, and the second round was completed in 2019. The third round of sampling is underway.
Overall, a variety of contaminants of concern have been identified through the routine monitoring of toxics in fish. While levels of PFAS, dioxins-furans, and chlorinated pesticides (e.g., chlordane and dieldrin) have triggered several consumption advisories, mercury and polychlorinated biphenyls (PCBs) have been the two dominant contaminants responsible for many of New Jersey’s fish consumption advisories.
Mercury is a toxic metal that has been used in several products such as thermometers and electrical switches. There are many natural and man-made sources of mercury in the environment including the burning of fossil fuels such as coal, incineration of wastes, and metal processing and manufacturing. Mercury released to the environment can end up in local water bodies through water transport, atmospheric deposition, or other pathways, where it can be transformed into the more toxic methylmercury form. Methylmercury accumulates in fish tissue through the aquatic food chain. Consumption of fish with methylmercury above certain levels can damage the nervous system, particularly in fetuses and young children, resulting in learning and developmental delays. With regular consumption, even low amounts of methylmercury may cause subtle effects on the central nervous system in both children and adults. In addition, long-term consumption of fish with elevated levels of methylmercury by adults and older children may result in adverse health effects, including neurological damage.
PCBs are organic compounds that once released into the environment tend to stay mostly in soil and sediment, but often these compounds can also be found in the air and water. PCBs were produced commercially for industrial application in heat transfer systems, hydraulic fluids, and electrical equipment. They were later incorporated into other uses such as printing inks, paints, and pesticides. The manufacturing of PCBs was stopped in 1979 as a result of evidence that PCBs build up in the environment and cause harmful effects to humans and wildlife. Release to the environment and subsequent migration through water transport, atmospheric deposition or other mechanisms, make PCBs available to a wide variety of aquatic and terrestrial organisms. Once PCBs enter the food chain, they tend to absorb into lipid rich (fat) tissue and organs, building up to levels that are hundreds of thousands of times higher than the levels in the surrounding water. This bioaccumulation is then magnified upward through the food web as, for example, when smaller fish are consumed by larger fish. Ultimately, when people consume fish that already have accumulated and magnified levels of PCBs, the PCBs then accumulate in the organs and fatty tissues in their bodies. PCBs have been shown to cause cancer in animals, and there is evidence that PCBs may cause cancer in exposed humans. PCBs also have been shown to cause several other serious health effects, including effects on the nervous systems of developing fetuses1, the immune system2 and the reproductive system3. Numerous health studies have shown that fetuses and young children are most at risk to PCB exposure and reducing everyone’s exposure to PCBs is of primary importance4.
Status and Trends
PCBs
Changes in the concentration of PCBs in fish tissue over time were evaluated for three data sets: 1) fish tissue samples collected in New Jersey’s coastal waters; 2) freshwater fish species from the NJDEP Toxics in Biota routine monitoring program; and 3) eight sites in the main stem of the Delaware River with samples collected by the Delaware River Basin Commission (DRBC).
Coastal Fish and PCBs
Consistent declines in PCB concentrations for two important fish species, striped bass and bluefish, are evident in fish tissue samples collected in New Jersey’s coastal waters (Figure 1). Both striped bass and bluefish are highly prized by anglers and consumers. They are both migratory fish species that are available seasonally along the coast. Their annual migration extends from North Carolina to Maine and both species spend extended periods of time in New Jersey estuarine and near-shore marine waters. While the PCB data for these species were collected within New Jersey coastal boundaries, these data could be representative of the general declining trend in PCBs along the east coast.
The average PCB levels in bluefish captured in New Jersey’s coastal waters were approximately 1,800 ng/g or ppb (n = 18) in 1976 and peaked at 2,400 ng/g in 1982 (Figure 1). By 2017, the concentration of PCBs in the sampled bluefish declined to an average of 315 ppb (n = 8) in 2017. For striped bass captured in coastal waters, the average PCB concentration dropped from an average of 678 ppb in 1999 to 212 ppb in 2016. Unfortunately, inconsistent data availability for size, age, and sex makes it difficult to compare PCB concentrations statistically. Nevertheless, the data are suggestive of declining trends in fish tissue concentrations from 1976 to 2017.
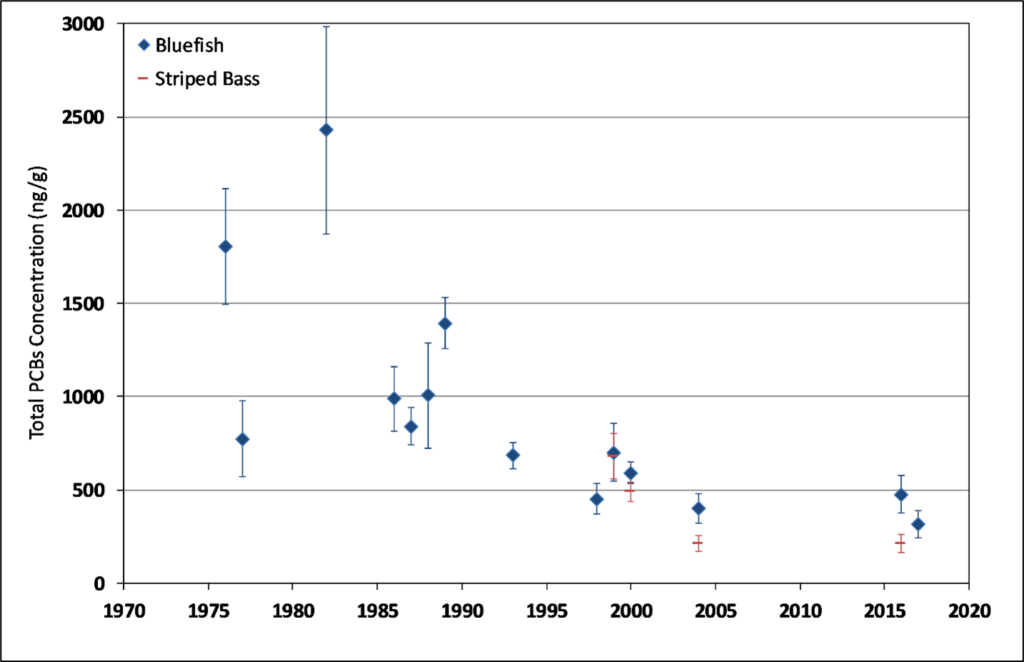
Figure 1. Average Concentration of Total PCBs in Bluefish (1976-2017) and Striped Bass (1999-2016) in New Jersey Coastal Waters (+/- 1 Standard Error,1976 to 2017).
Freshwater Fish and PCBs
State-wide trend assessments of PCB concentrations in freshwater fish species were evaluated using data from the Toxics in Biota routine monitoring program collected from 1999 to 2018. The following fish were collected as part of the routine monitoring effort and assessed for changes in PCB concentrations – Catfish (including Channel Catfish, White Catfish, Brown Bullhead, and Yellow Bullhead), and four individual fish species – American Eel, Largemouth Bass, White Perch, and Smallmouth Bass. As with the coastal waters, sample size, time of year collected, size, and sex differences preclude an accurate assessment of statistically significant trends, but data suggest that there are no apparent trends for Catfish, American Eel, and Largemouth Bass. However, there does appear to be a potential declining trend in tissue concentrations of PCBs in Perch (Figure 2) and Smallmouth Bass (Figure 3).
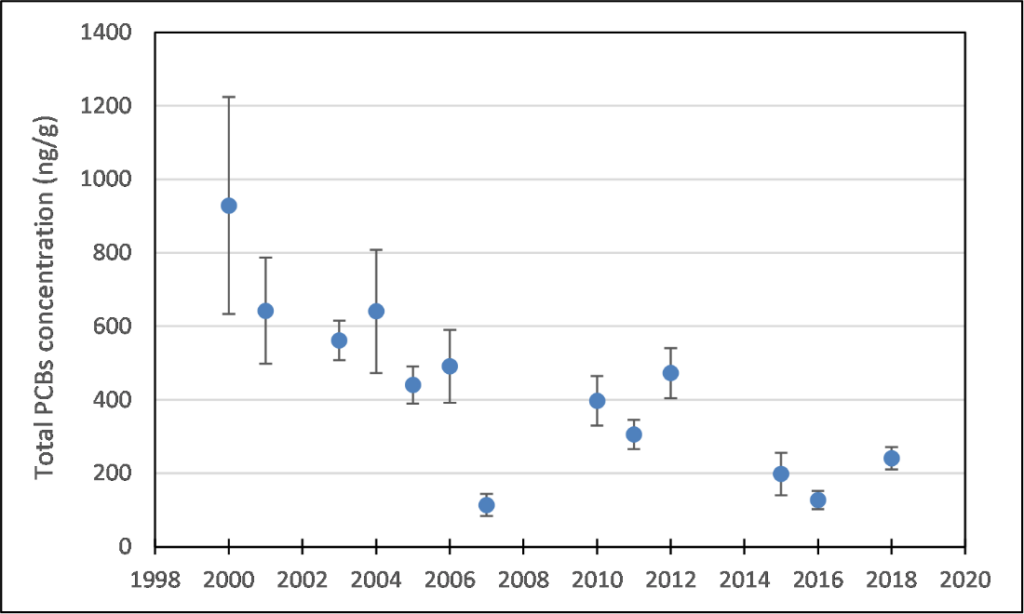
Figure 2. Average Concentration of Total PCBs in Perch Collected Statewide in New Jersey (+/-1 Standard Error, 2000 to 2018)
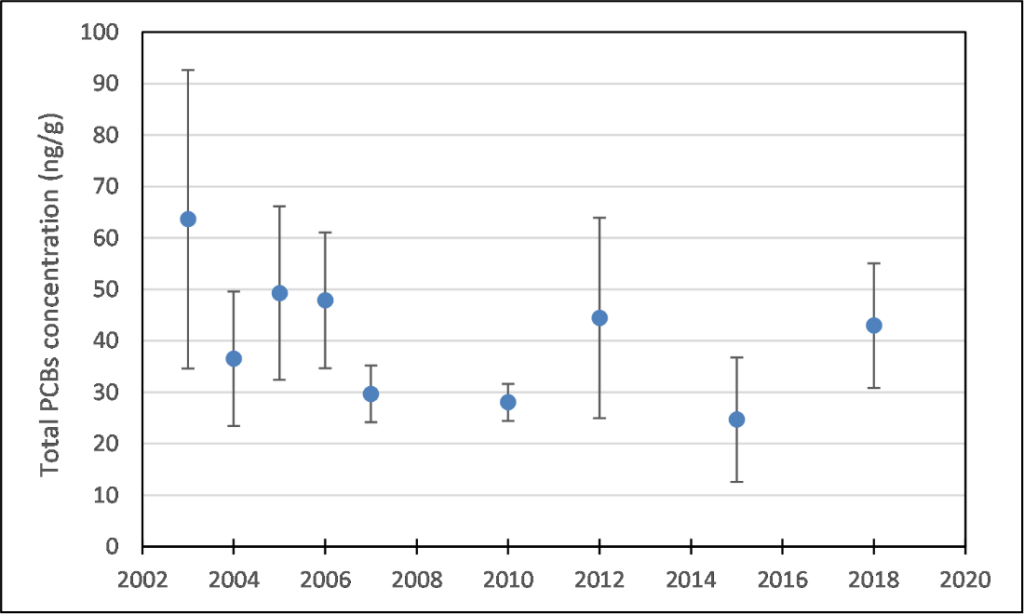
Figure 3. Average Concentration of Total PCBs in Smallmouth Bass Collected Statewide in New Jersey (+/- 1 Standard Error, 2003 to 2018)
Delaware River Fish and PCBs
In addition to fish tissue data collected by NJDEP, the Delaware River Basin Commission has a robust PCB fish concentration data set from eight sites along the main stem of the Delaware Rivera. These data were sorted by location, fish species, and year, and analyzed for trends with nonparametric correlation tests (Kendall’s Tau, p < 0.1). It is assumed that the sample collection for each year represents fish with a similar distribution of characteristics, including sex and size.
In 2014, there were two locations with declining concentrations and one location with increasing concentrations. With the inclusion of 2018 data, there was evidence of a decreasing trend at four stations and no sites suggested an increasing trend. Overall, these results are consistent with a general observation that no marked trends in PCB levels are currently evident in the region for the recent past. The results are summarized in Table 1.
|
Table 1 Evidence of Trends in PCB Concentrations in Fish, Delaware River |
|||||
| Site Name | Period | Species | 2014 Trend* | 2018 Trend* | |
| Crosswicks Creek | 2001 to 2018 | Channel Catfish | No trend | Decreasing | |
| Crosswicks Creek | 2000 to 2018 | White Perch | No trend | No trend | |
| Easton | 2004 to 2018 | Smallmouth Bass | No trend | No trend | |
| Easton | 2004 to 2018 | White Sucker | Decreasing | No trend | |
| Lambertville | 2004 to 2018 | White Sucker | No trend | No trend | |
| Lambertville | 2004 to 2018 | Smallmouth Bass | Decreasing | No trend | |
| Milford | 2004 to 2018 | Smallmouth Bass | No trend | Decreasing | |
| Milford | 2004 to 2018 | White Sucker | No trend | No trend | |
| Raccoon Creek | 2004 to 2018 | Channel Catfish | No trend | No trend | |
| Raccoon Creek | 2004 to 2018 | White Perch | No trend | No trend | |
| Salem River | 2004 to 2018 | Channel Catfish | No trend | No trend | |
| Salem River | 2004 to 2018 | White Perch | No trend | No trend | |
| Tacony Palmyra | 2001 to 2018 | Channel Catfish | No trend | Decreasing | |
| Tacony Palmyra | 2001 to 2018 | White Perch | No trend | Decreasing | |
| Woodbury Creek | 2004 to 2018 | White Perch | No trend | No trend | |
| Woodbury Creek | 2004 to 2018 | Channel Catfish | Increasing | Decreasing | |
* The presence of a trend was assessed using Kendall’s Tau and p < 0.1.
Mercury
In New Jersey, the analysis of mercury in fish was initiated in the 1970s but it was not until early 1992 that a larger and more extensive sampling effort was initiated. That extensive sampling effort was continued by the routine monitoring program.
The data provided below are on a variety of trophic levels of fish species collected from the freshwaters of New Jersey. For these data, largemouth bass and chain pickerel represent the highest trophic level sample. These two species have the highest concentrations of mercury both statewide and by region. The data also provide insight as to the status and trends for species analyzed from other trophic levels. Lower trophic level species (e.g., sunfish) and benthic omnivores (e.g., bullhead, white catfish) are also represented.
Freshwater Fish and Mercury
Overall, there does not appear to be a clear change in mercury concentrations in this broad range of fish species. Sample sizes collected in each time period are not large enough to assess the statistical significance of trends in specific waterbodies or by region. In addition, other characteristics that may impact the bioaccumulation of mercury in fish tissue, such as size and sex, are not available for all samples in the dataset. However, it is notable that the concentrations of mercury are generally higher in Pinelands waters in the species groups analyzed: pickerel, largemouth bass, channel and white catfish, & brown and yellow bullheads (Figures 4, 5 and 6). It is known that Pinelands water-quality characteristics, such as low pH and generally higher dissolved organic carbon, lead to increased methylmercury formation and bioaccumulation.
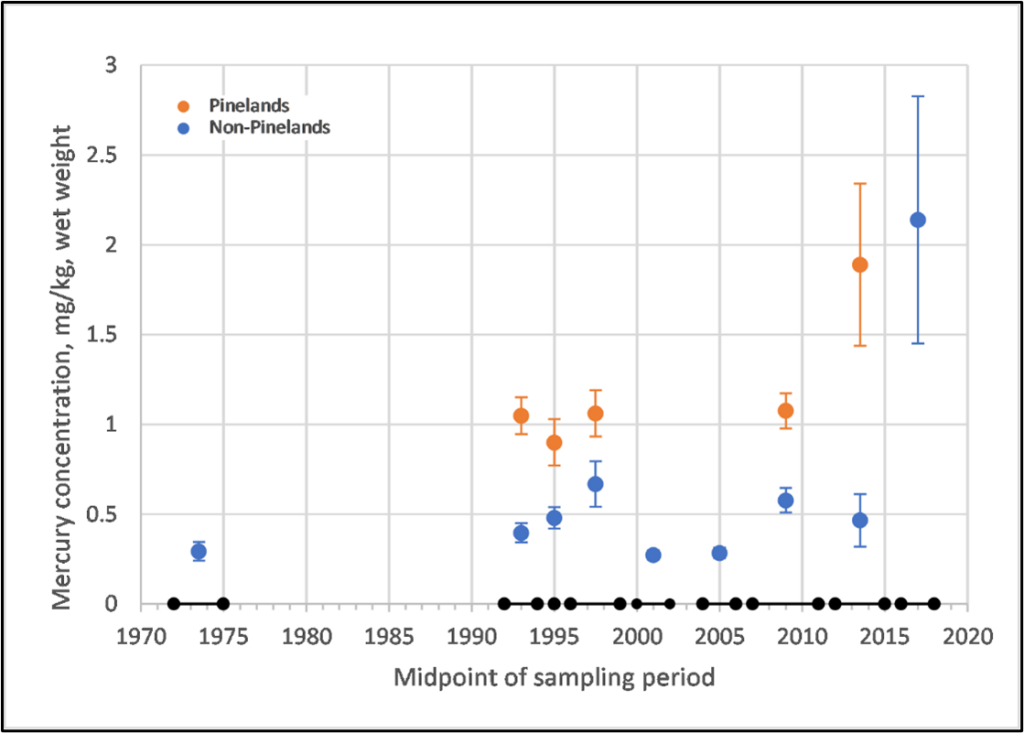
Figure 4. Average Concentration of Mercury in Pickerel Collected in New Jersey Pinelands and Non-Pinelands (+/- 1 Standard Error, 1972 to 2018). Average concentrations are centered in the time period during which respective studies were conducted and are shown by the horizontal black bars along the x-axis.
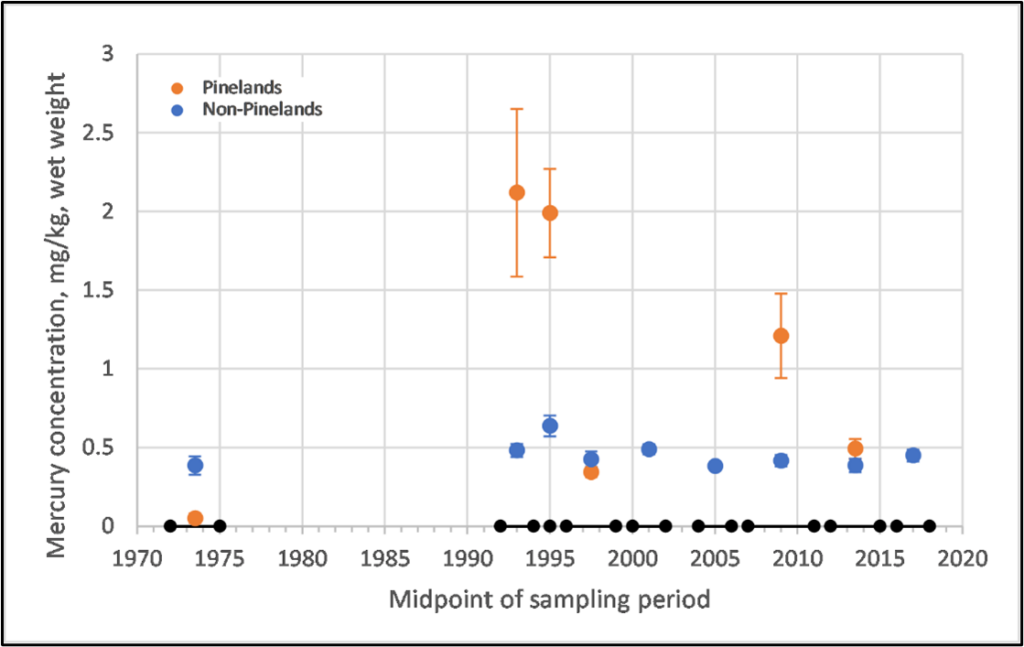
Figure 5. Average Concentration of Mercury in Largemouth Bass in New Jersey Pinelands and Non-Pinelands (+/- 1 Standard Error, 1972 to 2018). Average concentrations are centered in the time period during which respective studies were conducted and are shown by the horizontal black bars along the x-axis.
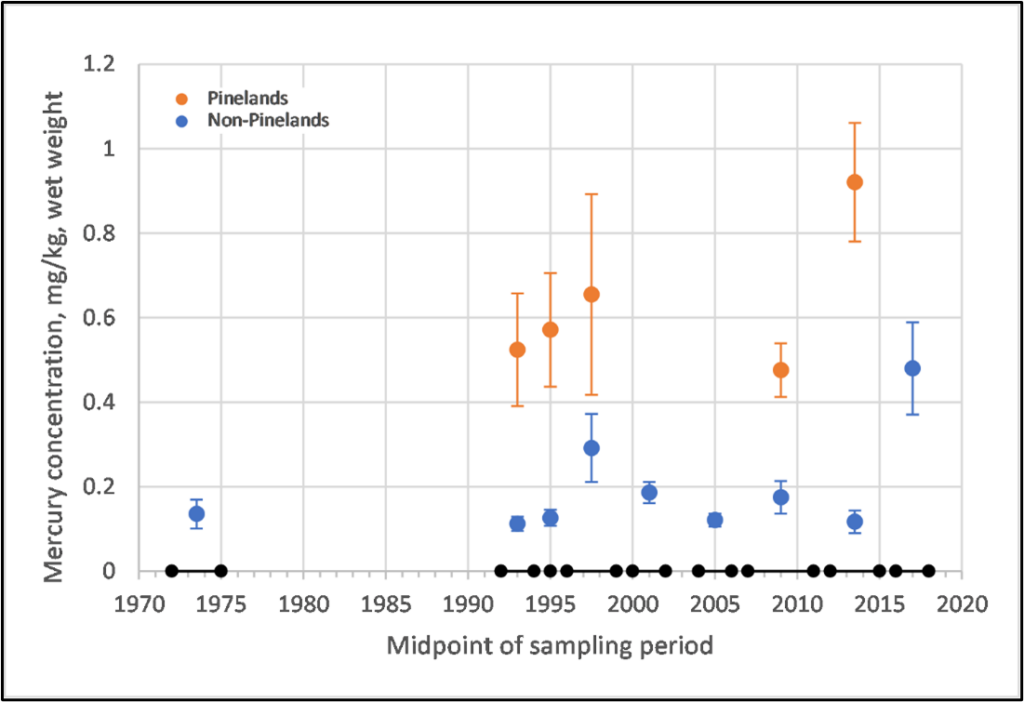
Figure 6. Average Concentration of Mercury in White Catfish and Bullheads Collected in New Jersey Pinelands and Non-Pinelands (+/-1 Standard Error, 1972 to 2018). Average concentrations are centered in the time period during which respective studies were conducted and are shown by the horizontal black bars along the x-axis.
Delaware River Fish and Mercury
Mercury concentrations have also been measured at the eight sampling locations along the main stem of the Delaware River for the period 2000 through 2018 by DRBCa. These data were sorted by location, fish species, and year, and analyzed for trends with nonparametric correlation tests (Kendall’s Tau, p < 0.1). It is assumed that the sample collection for each year represents fish with a similar distribution of characteristics, including sex and size. Trends calculated through 2014 showed decreasing trends at three sites with no trend for the remaining sites. With the inclusion of data through 2018, the trends show a shift. Four locations show some evidence of increasing concentrations, while there is evidence of declining concentrations at one station. The results are summarized in Table 2.
|
Table 2 |
||||
|
Evidence of Trends in Mercury Concentrations in Fish, Delaware River |
||||
| Site Name | Period | Species | 2014 Trend* | 2018 Trend* |
| Crosswicks Creek | 2001 to 2015 | Channel Catfish | No trend | No trend |
| Crosswicks Creek | 2000 to 2015 | White Perch | No trend | Increasing |
| Easton | 2004 to 2015 | White Sucker | Decreasing | Decreasing |
| Easton | 2004 to 2015 | Smallmouth Bass | No trend | No trend |
| Lambertville | 2004 to 2015 | Smallmouth Bass | No trend | Increasing |
| Lambertville | 2004 to 2015 | White Sucker | No trend | No trend |
| Milford | 2004 to 2015 | White Sucker | Decreasing | No trend |
| Milford | 2004 to 2015 | Smallmouth Bass | No trend | No trend |
| Raccoon Creek | 2004 to 2015 | Channel Catfish | No trend | No trend |
| Raccoon Creek | 2004 to 2015 | White Perch | No trend | Increasing |
| Salem River | 2004 to 2015 | Channel Catfish | Decreasing | No trend |
| Salem River | 2004 to 2015 | White Perch | No trend | No trend |
| Tacony Palmyra | 2001 to 2015 | Channel Catfish | No trend | No trend |
| Tacony Palmyra | 2001 to 2015 | White Perch | No trend | Increasing |
| Woodbury Creek | 2004 to 2015 | Channel Catfish | No trend | No trend |
| Woodbury Creek | 2004 to 2015 | White Perch | No trend | No trend |
* The presence of a trend was assessed using Kendall’s Tau and p < 0.1.
Many other contaminants, such as dioxins and PFAS, bioaccumulate in fish tissue and may impact human health, and so those chemicals are included in fish monitoring efforts to apply protective consumption advisories. However, a longer-term sample collection is necessary to evaluate the concentration trends over time.
a Data available at www.nj.gov/drbc/programs/quality/fish-tissue.html.
Outlook and Implications
A number of steps have been taken by both the state and federal government to reduce levels of contaminants, such as PCBs, in the environment. In addition to the ban on PCB manufacturing, many hazardous waste sites have been cleaned up, proper disposal measures have been implemented, and sources continue to be identified for emissions and discharge reductions and remediation. These steps should lead to the continued decline of contaminants such as PCBs in fish.
Numerous actions have been taken to curb mercury emissions in New Jersey, including reductions in mercury releases from solid and medical waste incinerators, coal-burning power plants, iron and steel manufacturing plants, wastewater discharges from dental offices, and other sources. See the Mercury Emissions chapter in this Trends Report series. These actions are reducing mercury loadings to the waters of the state. Reduction efforts at the national level are reducing regional inputs as well. However, regional and global sources, especially coal-burning power plants, remain a significant source of mercury via atmospheric transport and deposition.
Additional data are needed to determine long-term trends in mercury and other contaminant levels in fish. To appropriately determine statistically significant trends in the concentration of contaminants in fish tissue, focused studies need to be designed that would incorporate all factors that could impact bioaccumulation of these contaminants and continue repetitive sample collection and assessment over multiple years. However, the use of monitoring data can provide some level of information that is suggestive of potential trends. Continued monitoring is needed to determine the effectiveness of environmental management efforts to reduce contaminant levels in fish to acceptable levels and to regularly review and revise fish consumption advisories.
More Information
- NJDEP Fish Consumption Advisories
- NJDEP DSR Workplan for Routine Monitoring Program for Toxics in Fish: Estuarine and Marine Waters
- EPA Advisories and Technical Resources for Fish and Shellfish Consumption
- Data in this report was provided by the DEP Division of Science and Research and by the Delaware River Basin Commission, via: www.nj.gov/drbc/programs/quality/fish-tissue.html.
References
1 Tilson, H.A., J.L. Jacobson, & W.J. Rogan. Poly-chlorinated biphenyls and the developing nervous system: cross-species comparisons. Neurotoxicol Teratol. 12:239-248 (1990).
2 Dewailly, E., P. Ayotte, S. Bruneau, C. Laliberte, D.C.G. Muir, & R.J. Norstrom. Inuit exposure to organochlorines through the aquatic food chain in arctic Quebec. Environ Health Perspect. 101:618-620 (1993).
3 Meeker, J. D., & R. Hauser. Exposure to polychlorinated biphenyls (PCBs) and male reproduction. Systems biology in reproductive medicine. 56(2): 122-131 (2010).
4 Ribas-Fito, N., M. Sala, M. Kogevinas, & J. Sunyer. Polychlorinated biphenyls (PCBs) and neurological development in children: a systemic review. Journal of Epidemiology and Community Health. 55(8): 537-546 (2001).