In This Report:
Other Links
Contact Us:

Air Toxics
Background
Air toxics are air pollutants that have the potential to cause adverse health effects and are not regulated through a National Ambient Air Quality Standard. Although there are no ambient standards for these pollutants, under the Clean Air Act Amendments of 1990, the U.S. Congress directed the U.S. EPA to reduce emissions of almost 200 air toxics1 by developing control technology standards for specific industries. These particular air toxics are listed in the amendments and are known as Hazardous Air Pollutants (HAPs). NJDEP periodically reviews air toxics emissions data from point, area, and mobile sources compiled by U.S. EPA and used to estimate air concentrations through dispersion modeling. The last update by U.S. EPA was in 2018 using 2014 emissions data.1
Some of the adverse health effects that can occur from exposure to air toxics include lung irritation, cancer, and reproductive and developmental effects.2 In New Jersey, exposure to air toxics is a problem that occurs throughout the entire state as a result of emissions from many types of sources, generally categorized as point, area, and mobile sources.
A point source is a stationary facility or process that emits an identifiable amount of air pollution during manufacturing, power generation, heating, incineration, or other such activity. Point sources include power plants, refineries, municipal waste incinerators, and other industrial sources that are regulated under state and federal programs.
Area, or nonpoint sources, are defined as small sources of air pollution, which by themselves may not emit very much, but when added together, can account for a significant portion of the State’s total emissions. These include small industrial sources that are often too numerous to be inventoried individually, such as autobody shops, gas stations, electroplaters, and dry cleaners. This category also includes smaller institutional/commercial heating, pesticide application, and population-related emissions from consumer product usage and residential heating.
Mobile sources are divided into two categories, on-road and non-road. On-road mobile sources are those found on roadways, including cars, trucks, buses, and motorcycles. The non-road mobile category includes such sources as aircraft, trains, lawnmowers, boats, and construction, and farm vehicles and equipment.
There are some pollutants that are present in the air originating from sources other than point, area, or mobile sources. These air toxics concentrations are attributable to long-range transport, unidentified emission sources, previous emissions of long-lived contaminants, secondary atmospheric formation, or natural emission sources.
Exposure to air toxics can be estimated from their actual measurement in ambient air or from predictive computer models that simulate dispersion of emissions from various sources. To determine the potential health effects of these monitored or modeled air levels, “health benchmarks” based on chemical-specific toxicity values developed by USEPA, California, or other government agency scientists are utilized. For non-cancer health effects, the benchmark is called a reference concentration, and it indicates the level to which someone can be exposed without detriment. For chemicals suspected of causing cancer (carcinogens), the health benchmark is based on a unit risk factor, which is derived from the chemical’s potency and the estimated likelihood of contracting cancer over a lifetime of exposure. The carcinogenic benchmark is the concentration that would potentially cause no more than a one-in-a-million incremental increase in the risk of developing cancer.
The air contaminant concentration graphs presented below include the chemicals’ health benchmarks.
Status and Trends
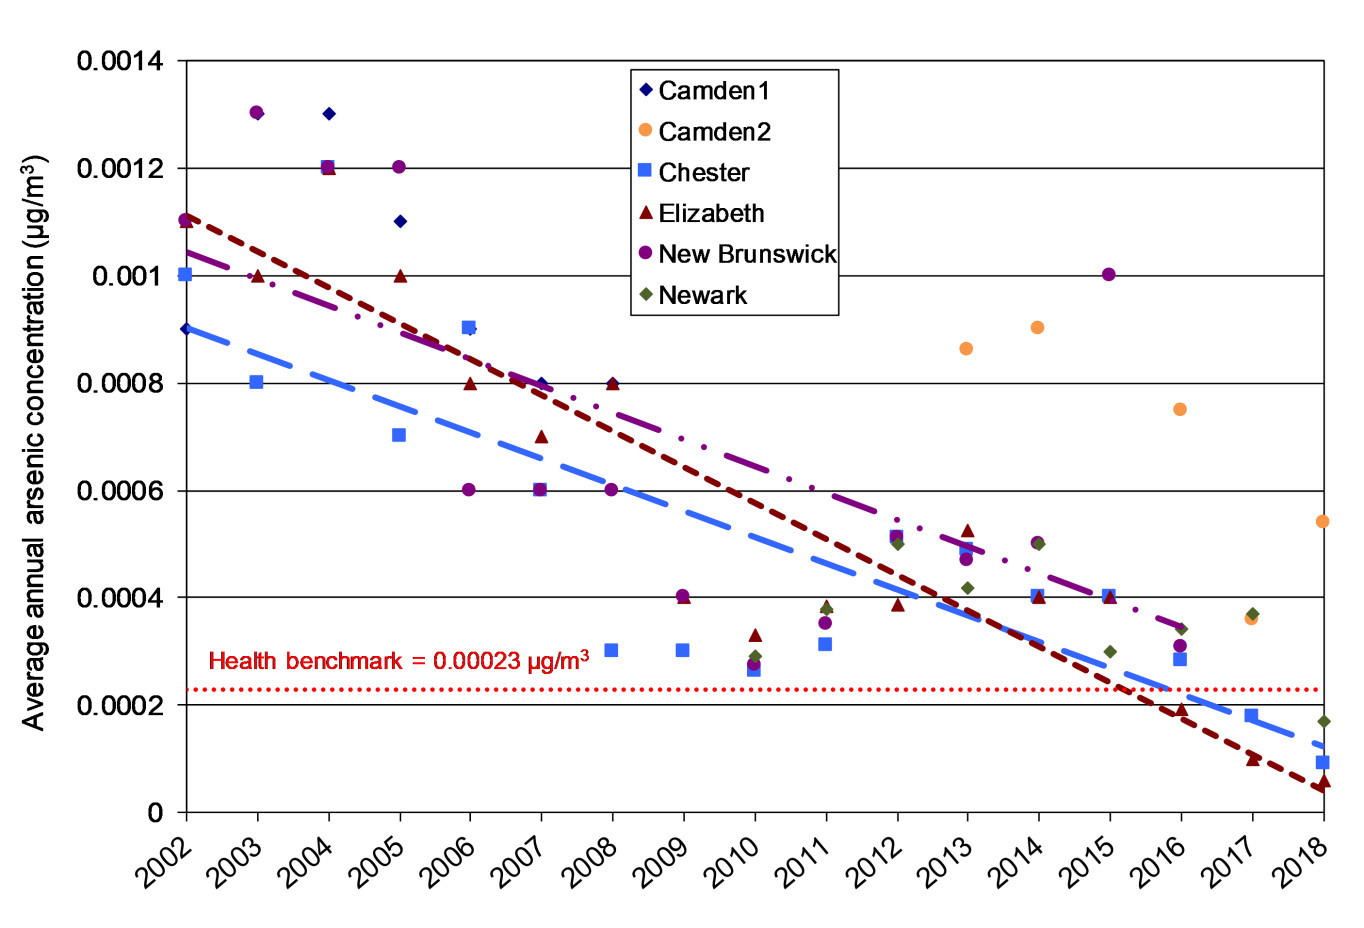
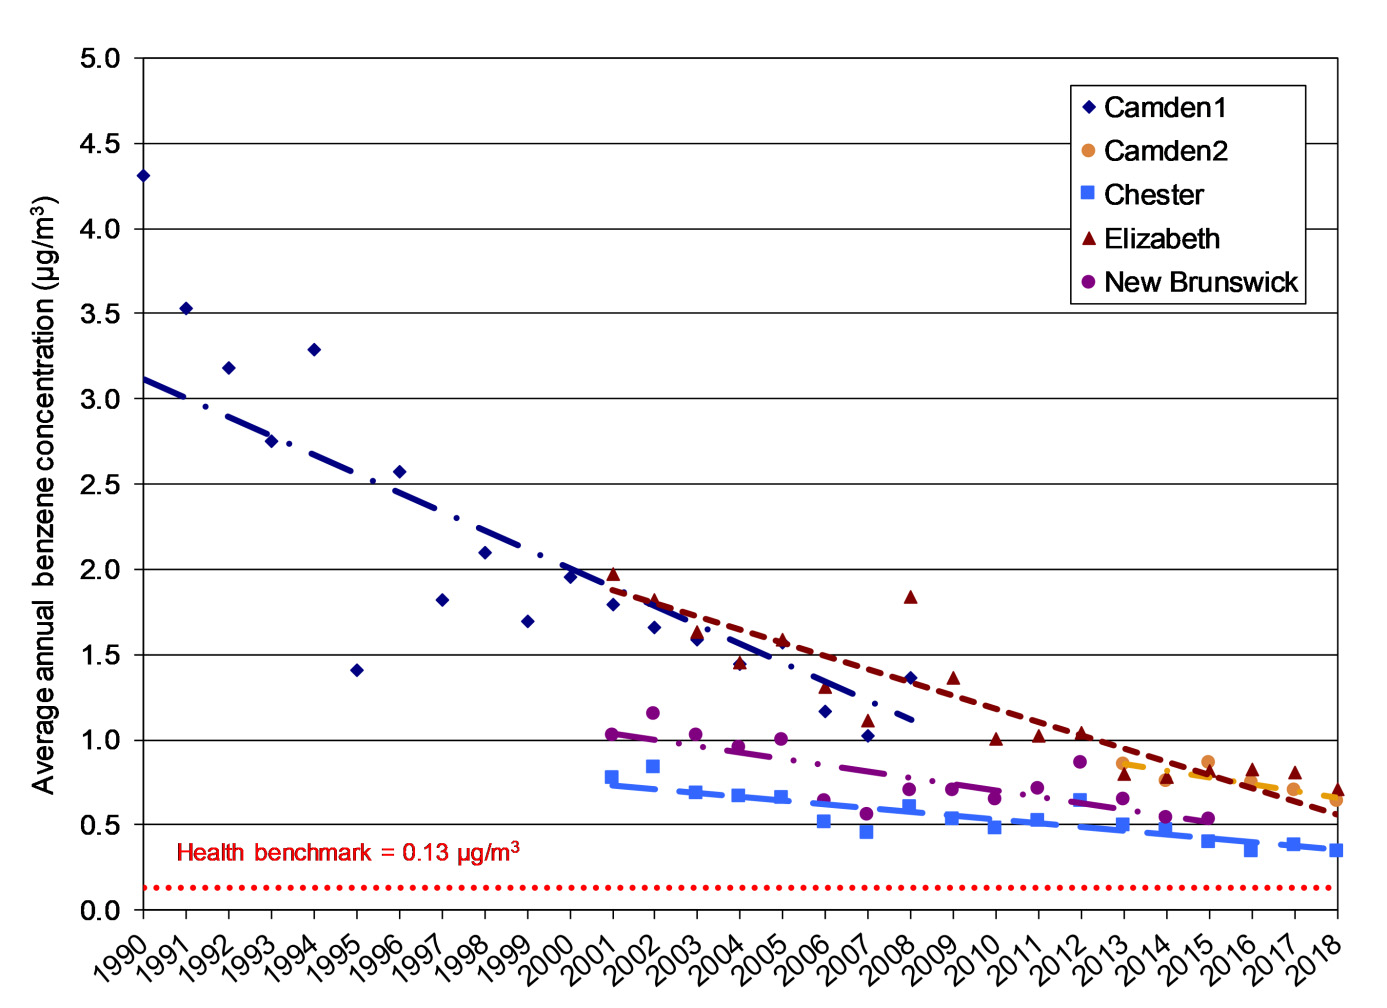
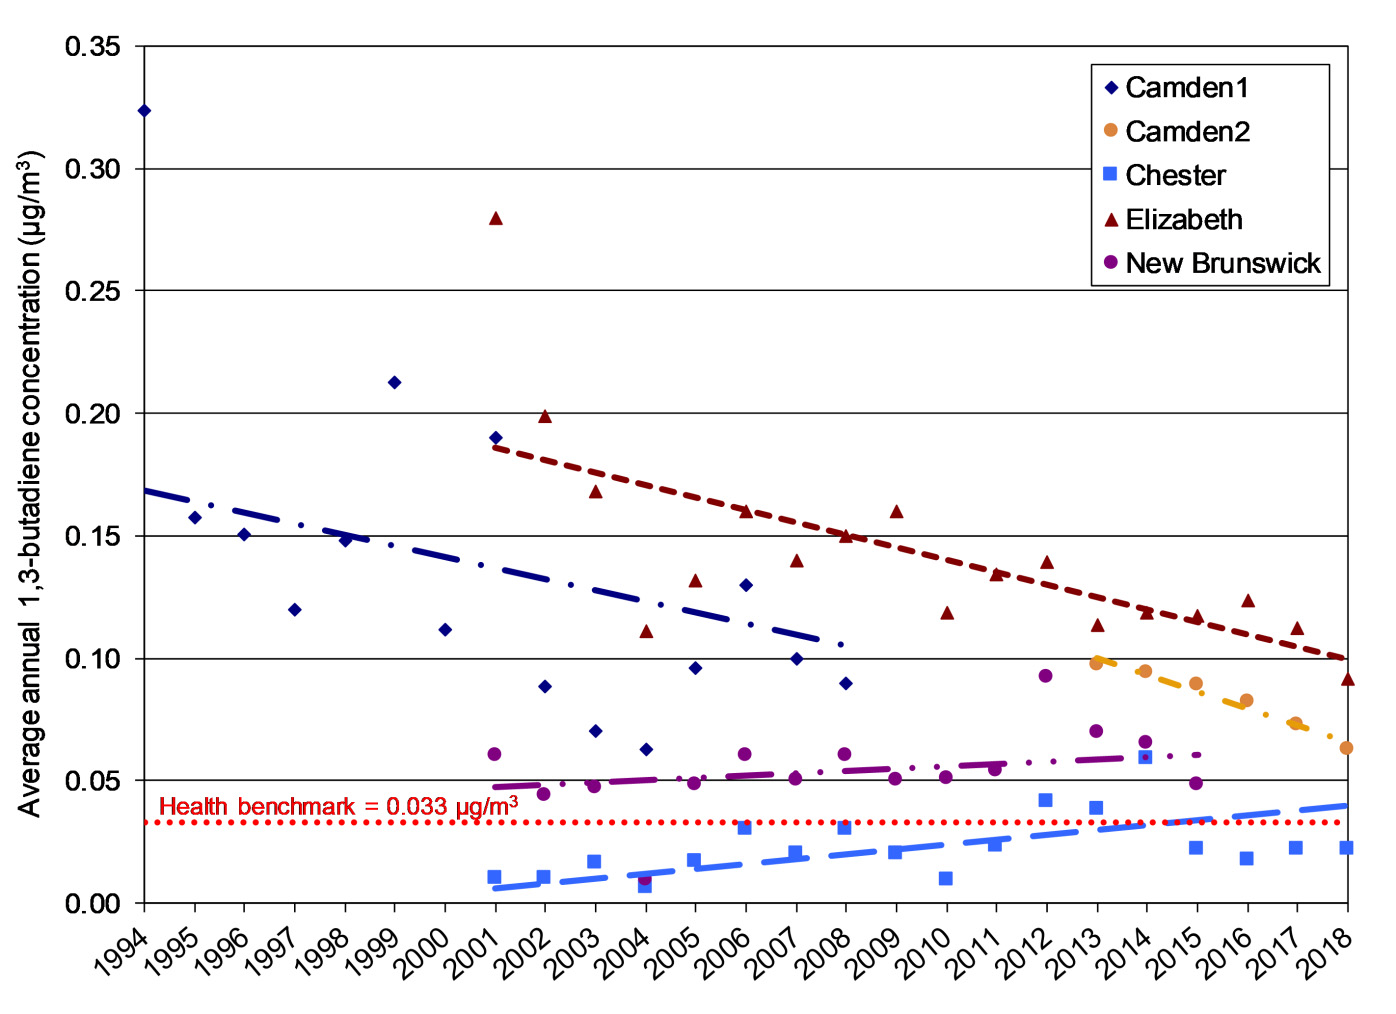
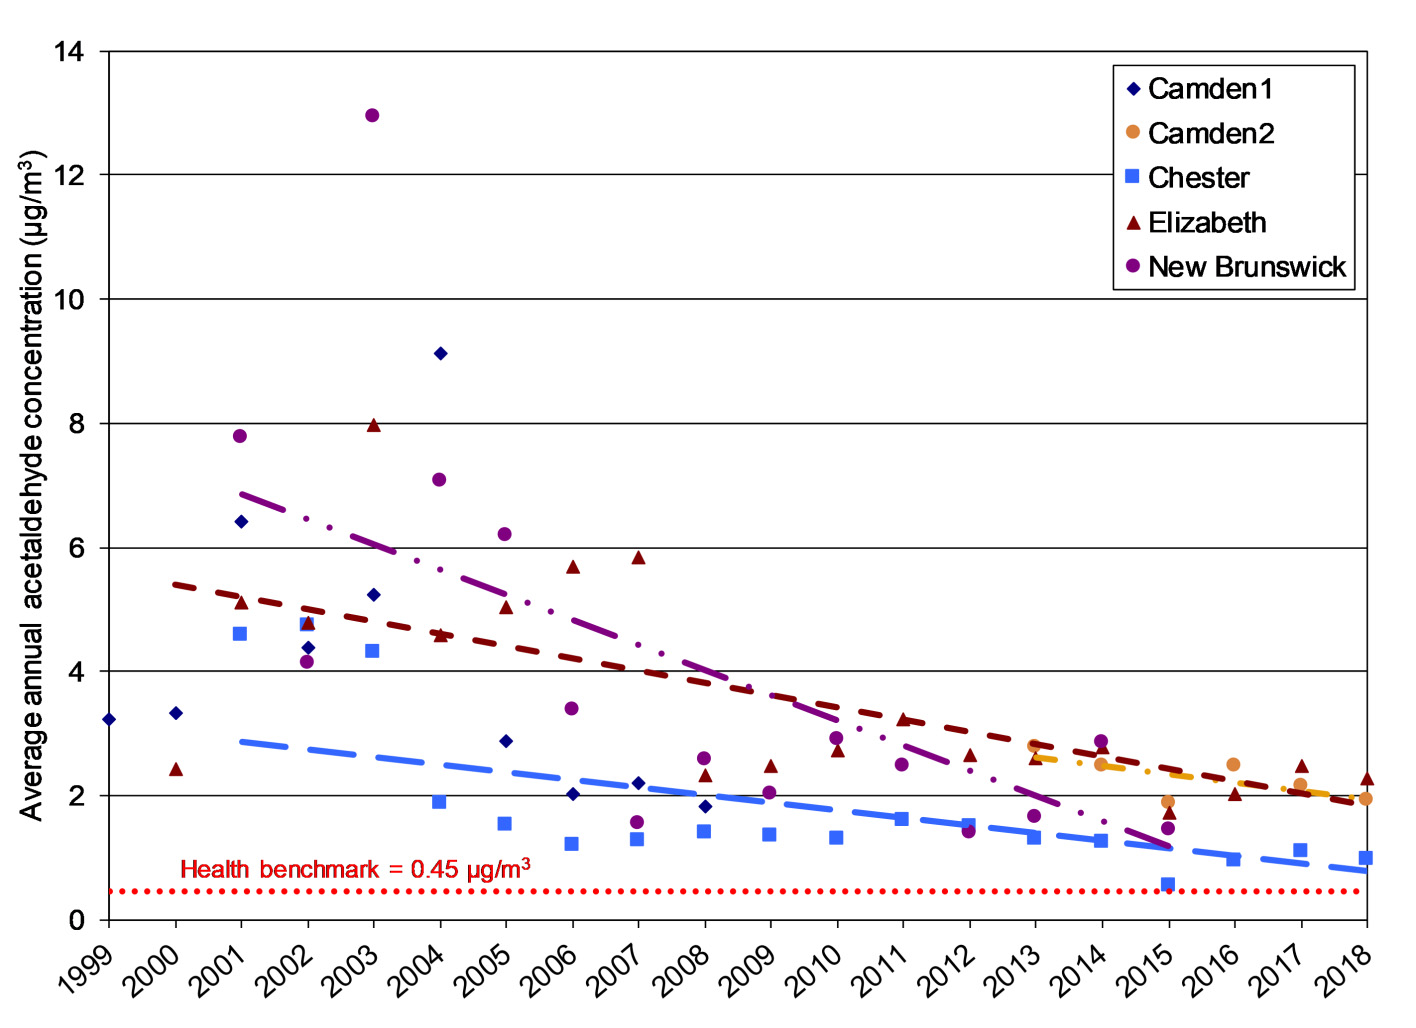
NJDEP has been measuring levels of toxic volatile organic compounds (VOCs) since 1989, when a monitor was set up in Camden (Camden 1) as part of USEPA’s Urban Air Toxics Monitoring Program. Additional monitors were established in Elizabeth (Union County) in 2000 and in Chester (Morris County) and New Brunswick (Middlesex County) in 2001. Also in 2001, NJDEP began measuring toxic metals at these four sites with Newark (Essex County) added as a metal monitoring site in 2010. The Camden monitoring station was shut down in 2008 when DEP lost access to the site, but a new station was initiated in 2013 (Camden 2). In 2016, the New Brunswick toxics monitor was moved less than a mile away to the Rutgers monitoring station.
DEP compiles annual reports summarizing monitoring results for air toxic VOCs and other compounds, such as metals. These are available on the Bureau of Air Monitoring’s web site (see the “More Information” section, below). The graphs below show selected historic data, displaying annual average concentrations. Trend lines, developed using linear regression, are shown only for parameters and locations where a trend was found to be statistically significant (i.e., Kendall Tau P-value ≤ 0.05). Locations where a trend is absent indicate that either the data are more variable or a ‘flat’ trend is evident (i.e., no significant change over time). Further discussion on the activities that influence the air toxics that exceed their health benchmarks can be found in the NJDEP Bureau of Air Monitoring Air Toxics Summary.2
The concentration of arsenic shown in Figure 1 represents the mass of that metal within the fine particle fraction (i.e., particles less than or equal to 2.5 micrometers in diameter, per cubic meter). Arsenic is present at concentrations that exceed the health benchmark by a higher margin than the majority of other metals measured in NJ2. Beginning in 2016, some arsenic values were recorded below the health benchmark for the first time in Chester, Elizabeth and Newark. In 2018, at four of the five stations where arsenic monitoring occurs, less than 50% of the data for arsenic were above the detection limit.
The VOC values shown in Figures 2-5 below represent gaseous concentrations. Benzene, formaldehyde, 1,3-butadiene, and acetaldehyde are VOCs present at concentrations that are greater than their health benchmark concentrations, resulting in risk ratios greater than one. Risk ratios are calculated by dividing the ambient air concentration of a pollutant by its health benchmark. When a risk ratio is less than one, the air concentration should not pose a health risk, whereas a risk ratio greater than one may be of concern. With the exception of 1,3-butadiene at two sites, all constituents shown in this report have been decreasing in concentration since monitoring was initiated.
Several other VOCs, including acrolein, carbon tetrachloride, chloroform, chloromethane (methyl chloride), and 1,2-dichloroethane (ethylene dichloride), although not presented graphically here, are also found to have risk ratios greater than one at all monitoring sites, whereas ethylbenzene was of concern only at the Camden site.2
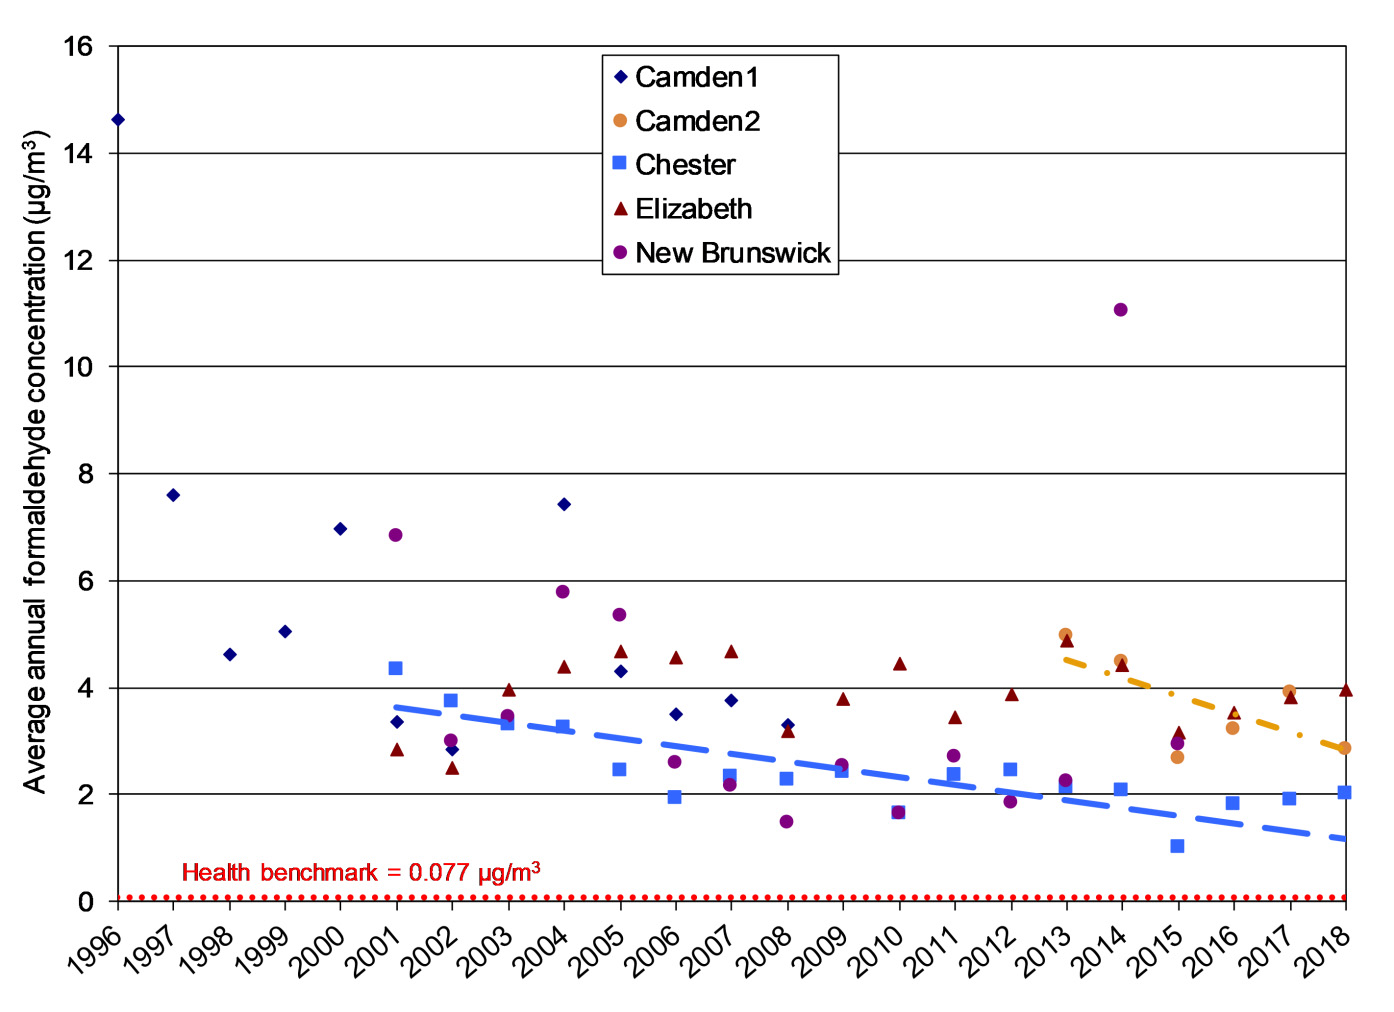
The primary source of most of the VOCs shown is the on-road mobile category (cars and trucks).2 The declining trends are suspected to reflect improvements in automotive technology and the more stringent emissions standards of recent years, although reductions in emissions from industrial and area sources have also played a role.
Outlook and Implications
NJDEP continues to monitor air toxics and evaluate measures to further reduce emissions of air toxics from all types of sources. Major point source emissions have been decreasing since the federal 1990 Clean Air Act Amendments imposed Maximum Achievable Control Technology (MACT) standards on specific industries.
The NJDEP Air Quality Permitting Program combines control technology (mostly based on EPA’s MACT requirements) and risk assessment to address emissions of air toxics from stationary sources, including certain types of industrial and commercial area sources. Regulations are in place that limit concentrations of toxic VOCs in consumer products, architectural coatings, adhesives and sealants, and portable fuel containers.
For mobile sources, the Motor Vehicle Inspection and Maintenance Program ensures that vehicles are operating with the proper emission controls. The Diesel Risk Reduction Program has been mandating and funding retrofits for school buses, solid waste trucks, municipal buses, and construction equipment. Anti-idling rules for diesel and gasoline vehicles restrict idling to no more than three consecutive minutes, if the vehicle is not in motion. In addition to these mobile source controls, in January 2020 the State set statutory goals for future adoption of plug-in battery-powered vehicles and plug-in electric hybrid vehicles under P.L. 2019 c.362. These goals include a target of 330,000 registered light-duty plug-in electric vehicles by December 31, 2025, and two million units by the end of 2035. By the end of 2040, 85% of new light-duty vehicles sold in the state should be plug-in electrics.
More Information
NJDEP Bureau of Air Monitoring and the NJDEP Air Quality Evaluation Section provided the data and information in this chapter. More information is available at:
NJDEP Web Sites:
- Air Toxics in New Jersey: https://www.nj.gov/dep/airtoxics
- Air Monitoring Web Site: https://www.nj.gov/dep/airmon
- Environmental Justice Program: https://njdepwptest.net/ej/
- Diesel Initiative: https://www.stopthesoot.org/
- Air Regulations: https://www.state.nj.us/dep/aqm
- Permitting Program for Stationary Sources: https://www.nj.gov/dep/aqpp
- Community-Based Projects:
- Camden Waterfront South Air Toxics Pilot Project: https://www.nj.gov/dep/ej/camden
- Urban Community Air Toxics Monitoring Project, Paterson: https://www.nj.gov/dep/dsr/paterson-study/
USEPA Web Sites:
- USEPA Hazardous Air Pollutants (HAPs): https://www3.epa.gov/ttn/atw/index.html
References
1 U.S. Environmental Protection Agency (U.S. EPA), 2018. National Air Toxics Assessment – 2014 NATA. https://www.epa.gov/national-air-toxics-assessment, Accessed 10/21/2020.
2 New Jersey Department of Environmental Protection (NJDEP), Bureau of Air Monitoring, 2019. 2018 New Jersey Air Quality Report. https://www.nj.gov/dep/airmon/pdf/2018%20NJ%20AQ%20Report-bookmarked.pdf, Accessed Oct. 2020