NJ Electric Vehicle Data
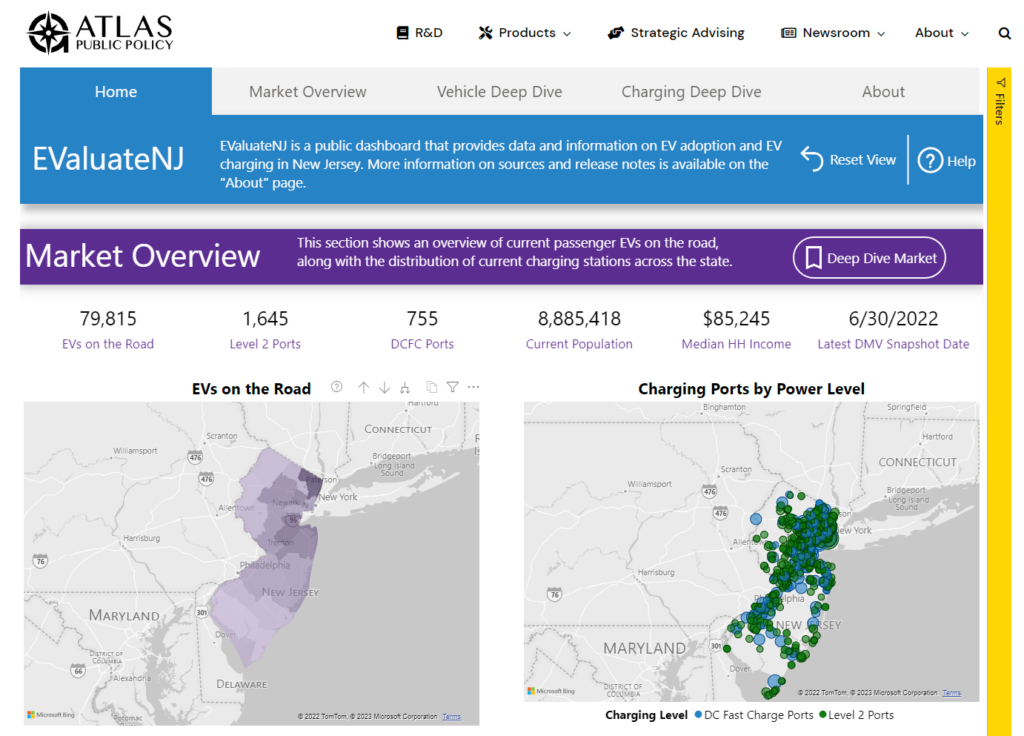
EValuateNJ
The EValuateNJ dashboard is made possible through a collaboration between the NJDEP and Atlas Public Policy to provide analytics regarding the state of transportation electrification in New Jersey. NJDEP provides decoded vehicle registration data to Atlas Public Policy twice a year and Atlas Public Policy obtains demographic data from the US Census Bureau, charging station data from the US Department of Energy and utility information, including retail electricity prices, from the US Energy Information Administration. The information below is a small snapshot of what is available in the EValuateNJ dashboard. Access the full EValuateNJ dashboard
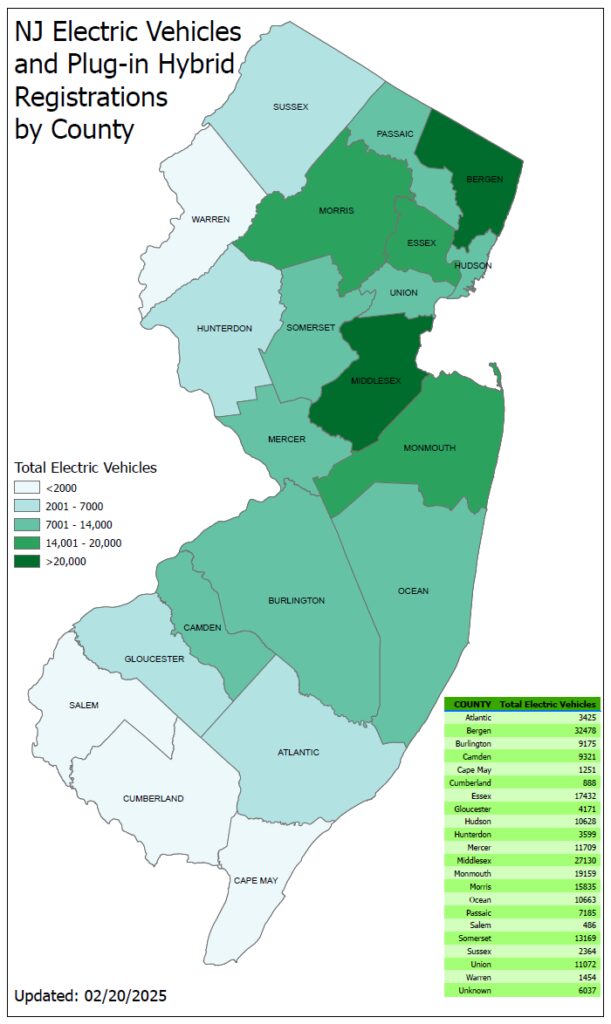
Electric Vehicles in New Jersey
The Electric Vehicle Registration data is a snapshot of active vehicle registrations. The chart will be updated and based on a snapshot of active registrations on June 30th and December 31st of each year.
NJ’s EV Percentage Growth
| EV percentage of NJ’s: | 2024 | 2023 | 2022 | 2021 | 2020 | 2019 | 2018 |
| Total registered vehicles | 2.97% | 2.2% | 1.43% | 0.95% | 0.61% | 0.45% | 0.34% |
| New vehicle sales | 13.56% | 12.2% | 8% | 4.8% | 2.6% | 1.5% | 1.5% |
The percentage of EV registrations and percentage of new EV sales information is a cumulative report of vehicle registrations over an entire year.
The Alternative Fuel Vehicle Report
The Alternative Fuel Vehicle (AFV) Report contains detailed information on all regular hybrid vehicles, plug-in hybrid vehicles, zero emission vehicles (including battery electric and fuel cell), and CNG/propane vehicles. This report is produced twice per year based on available registration data at the end of June and December. In the AFV report, you will find breakdowns of vehicle types by county and zip code.


