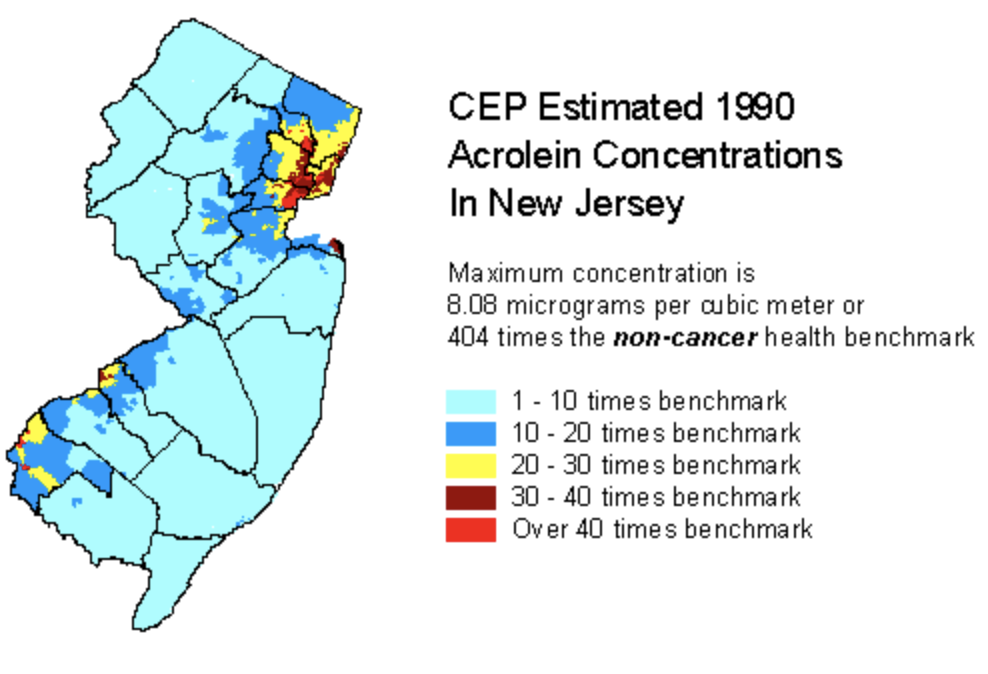
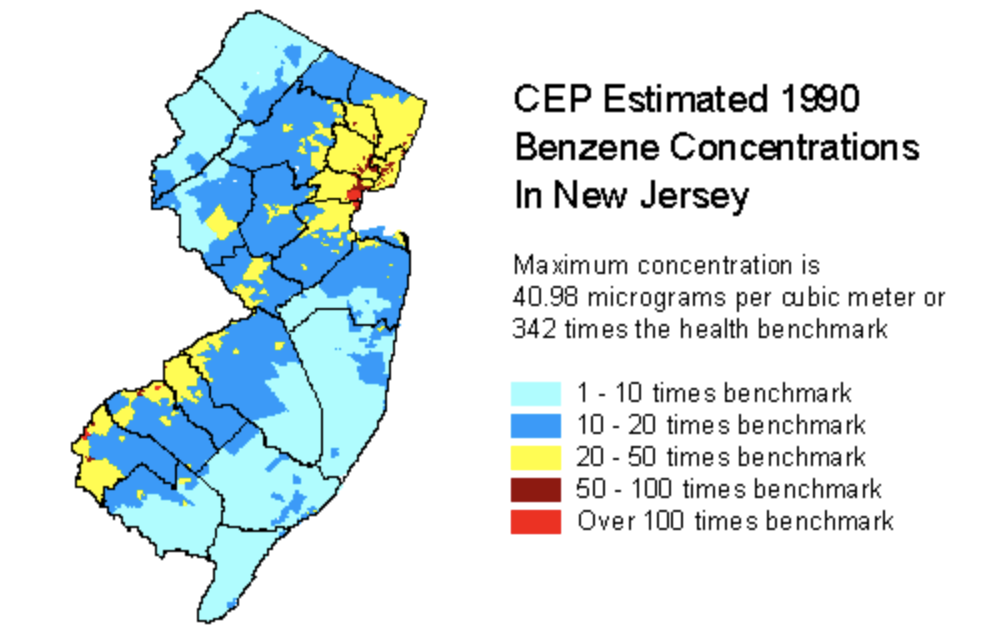
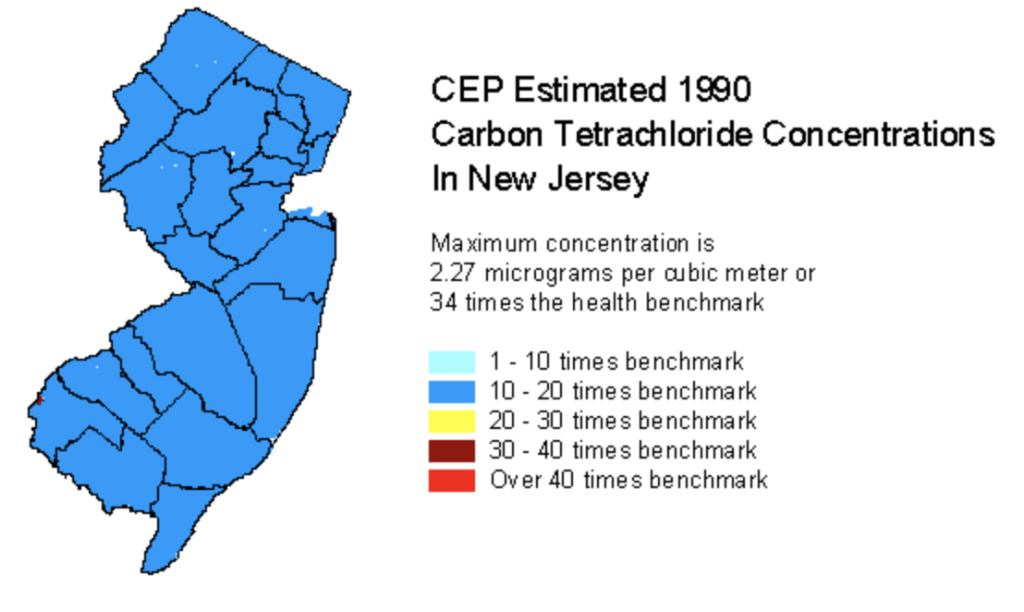
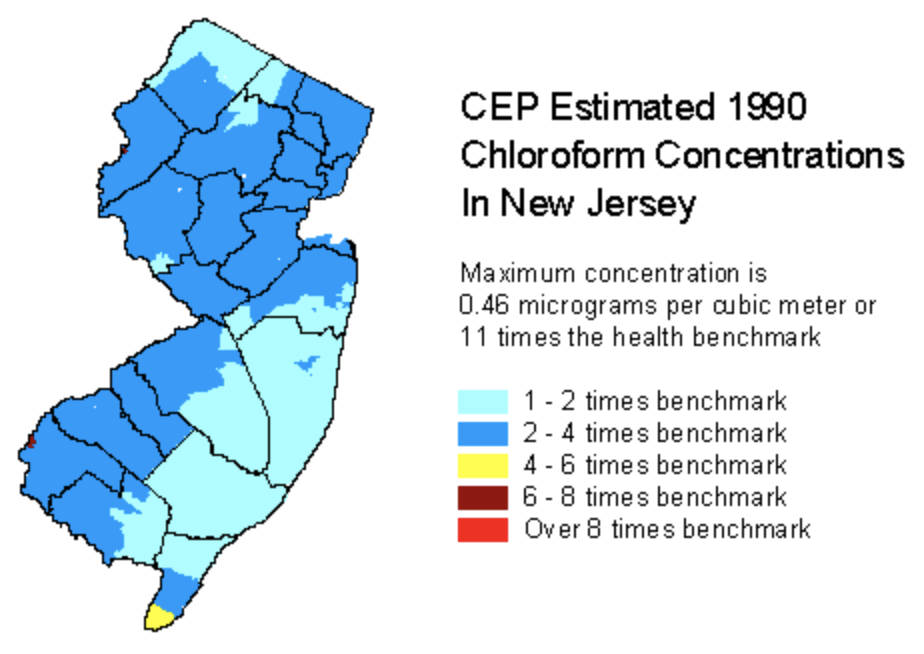
1990 CEP Air Toxics Assessment for New Jersey
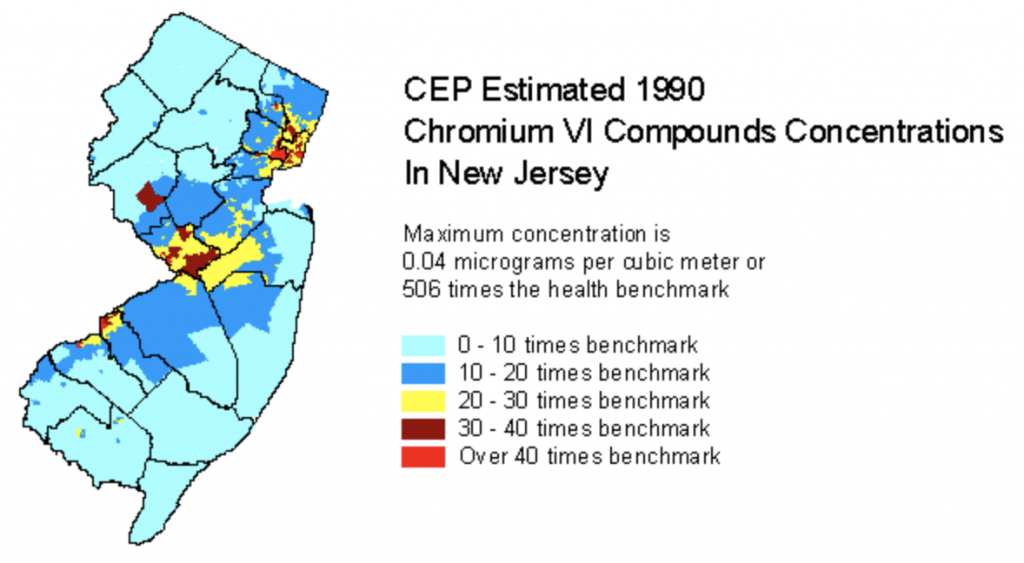
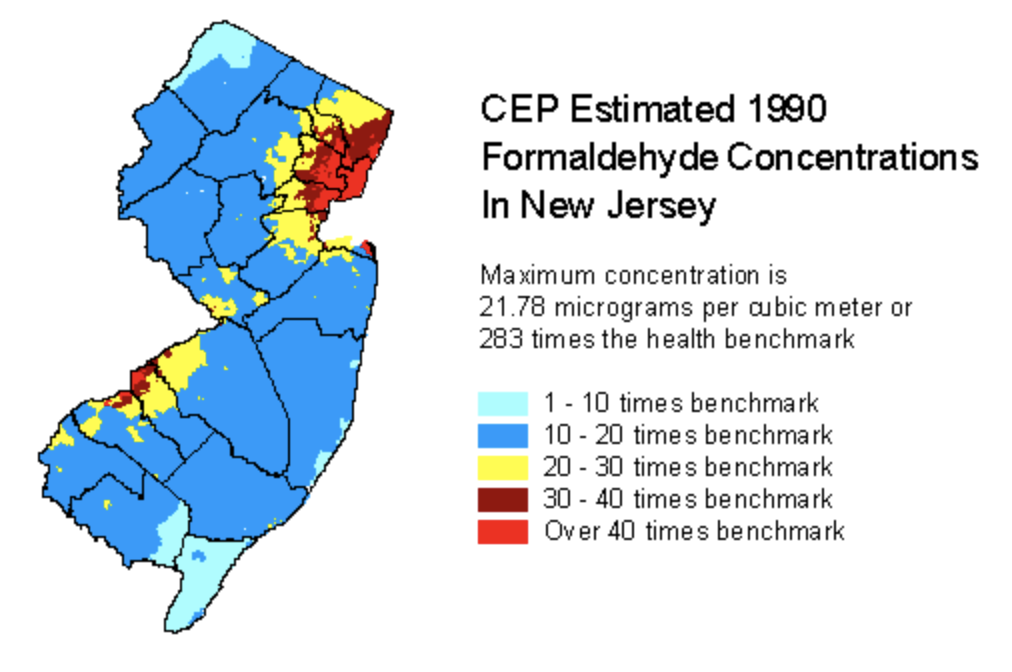
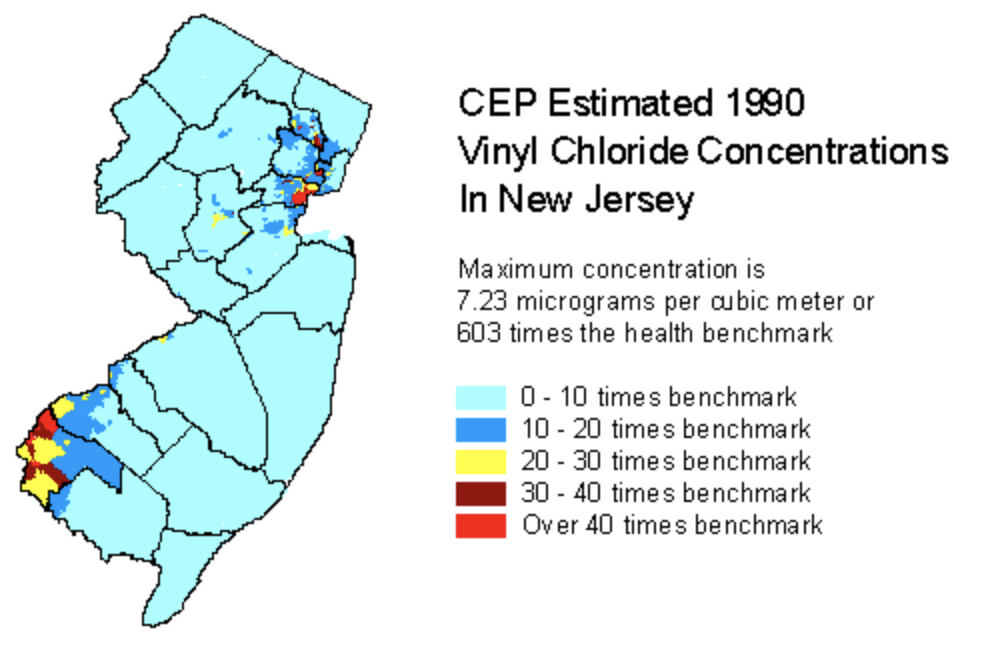
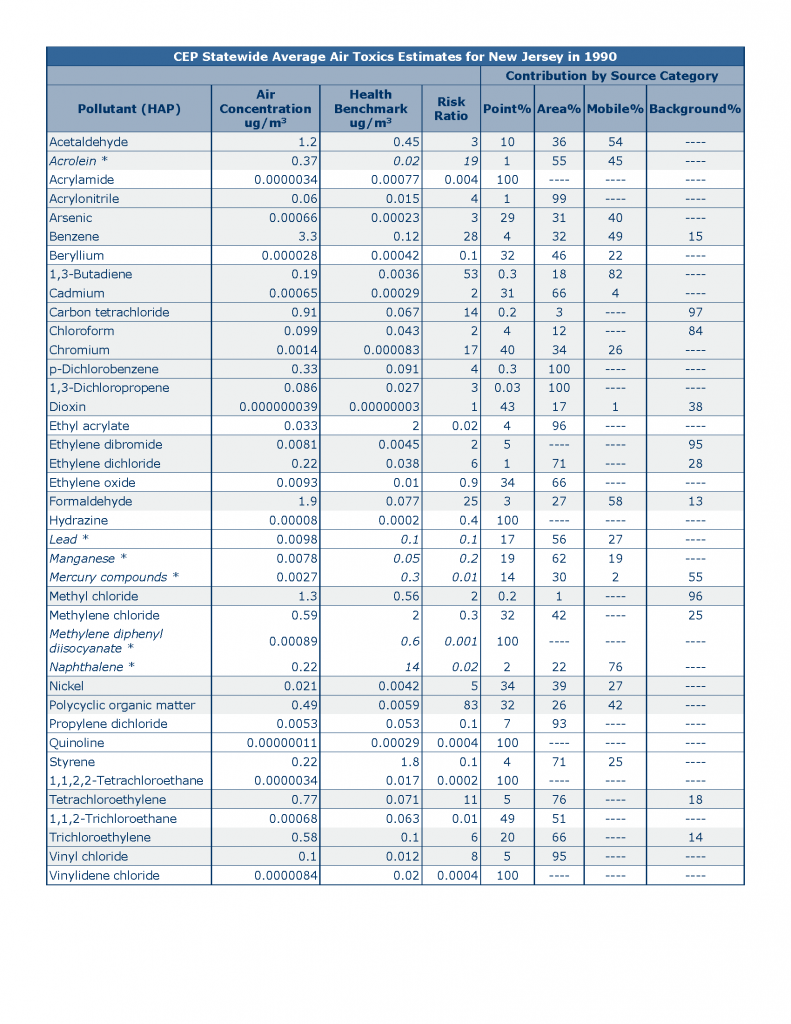
In their Cumulative Exposure Project (CEP) study for 1990, USEPA identified 39 critical pollutants out of the 148 HAPs included in the study which are important nationwide. The CEP study estimated that 25 of these pollutants exceed the health benchmarks in New Jersey.
COUNTY RISK RATIO TABLES
Health effects caused by air toxics can be broadly grouped into either cancer or noncancer effects. U.S. EPA and NJDEP use cancer and noncancer health benchmarks to evaluate risks from pollutants that people are exposed to in the environment. These benchmarks are based on studies that show just how toxic a specific chemical is, by estimating how much of a dose it takes to either cause cancer over a lifetime or to cause some other noncancerous effect (for example, on a particular organ). The benchmarks can be compared to the air concentrations predicted in the CEP. This comparison of the air concentration to the benchmark concentration gives us a number we call the “risk ratio.” If the risk ratio for a specific chemical is less than one, the air concentration does not pose a health risk. If it is greater than one, it may be of concern. The risk ratio shows just how much higher the air concentration is than the health benchmark.
For Each Table:
- Chemicals with risk ratios greater than or equal to 1 are in bold.
- Risk Ratios in italics are based on noncarcinogenic effects.
- The symbol ug/m3 is micrograms per cubic meter, the amount (in micrograms) of a chemical in a cubic meter of air. This is also known as a concentration.
- Acetaldehyde and formaldehyde concentration estimates include secondary formation, which is the process by which chemicals in the air are transformed into other chemicals.
- PAH/POM is “polycyclic aromatic hydrocarbons/polycyclic organic matter.” These define a broad class of compounds. The chemicals making up this class were broken up into 8 groups based on toxicity, and each group was assigned a cancer-weighted toxicity estimate. 0.0072 ug/m3 is the health benchmark average across the 8 groups.
