2018 Air Toxics Assessment for New Jersey
Of the 181 air toxics that USEPA included in the 2018 AirToxScreen, about one-third do not have toxicity values, or corresponding health benchmarks. For those that do, our analysis of the state and county average air toxics concentrations indicates that 14 of the pollutants are “of concern” because they were predicted to exceed their health benchmarks in one or more counties. Predicted concentrations of these pollutants vary around the state, depending on the type of sources that emit them. This is summarized in the table below.
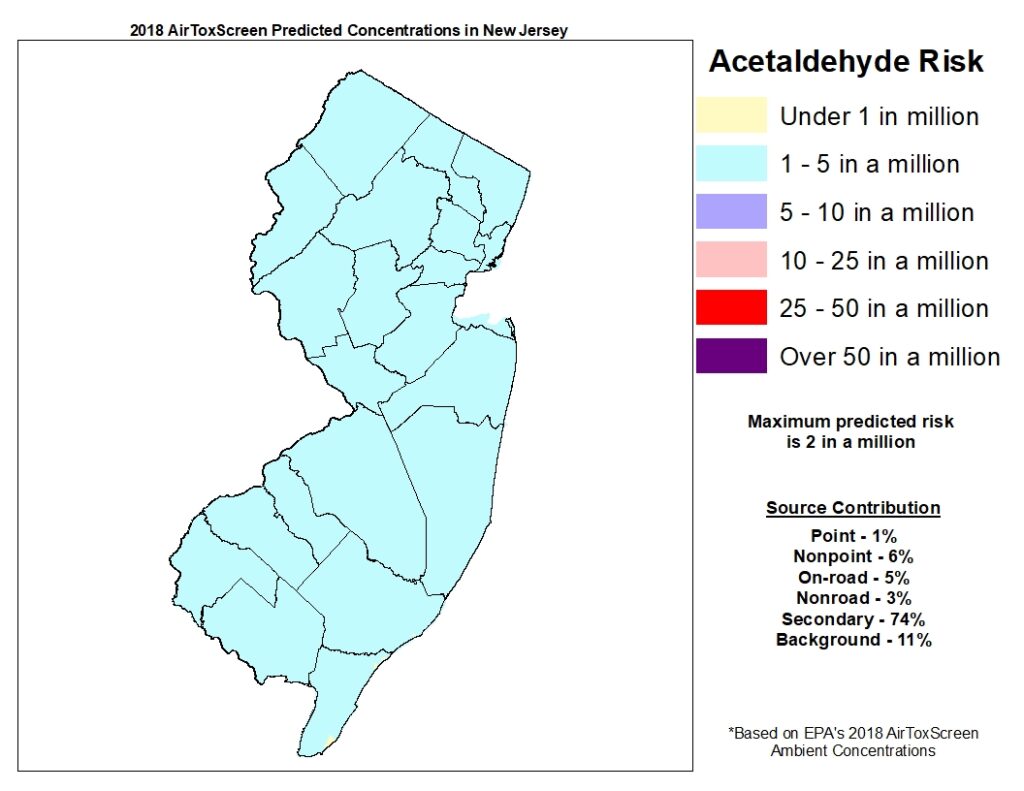
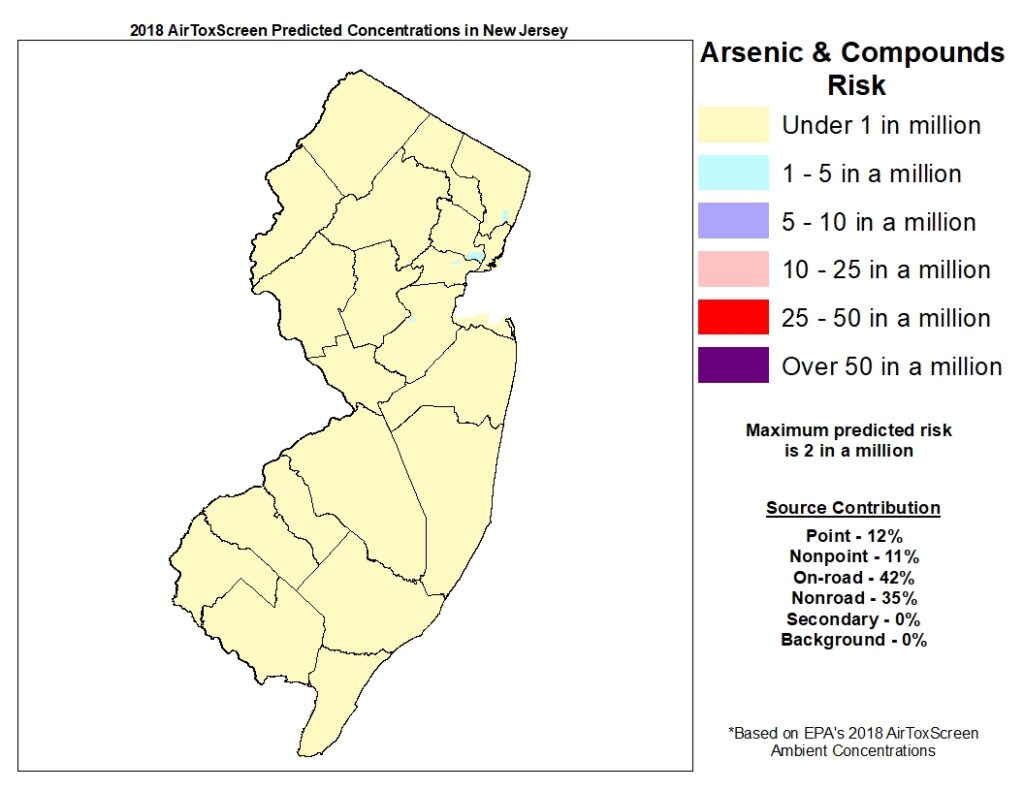
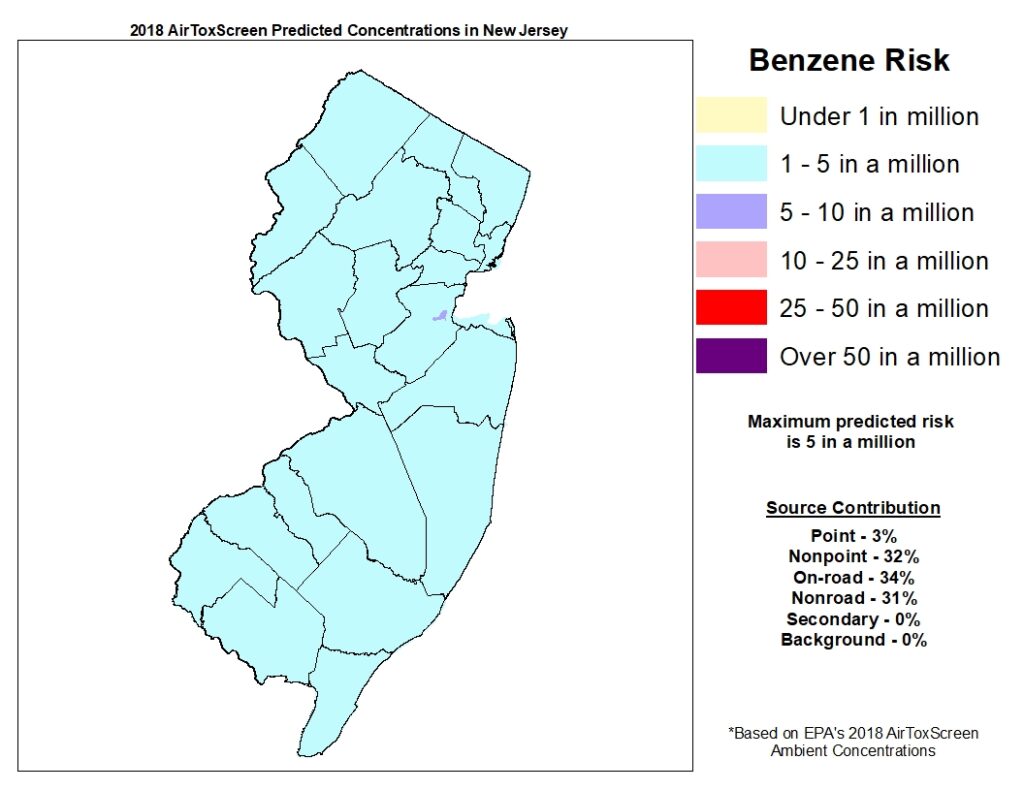
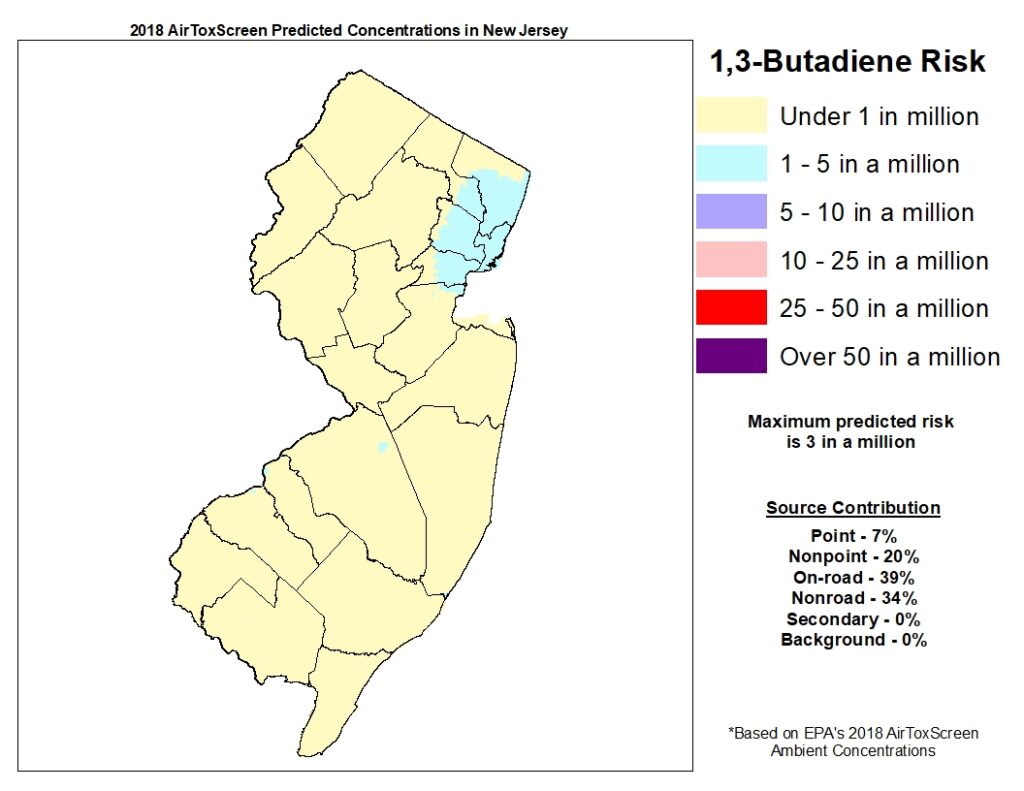
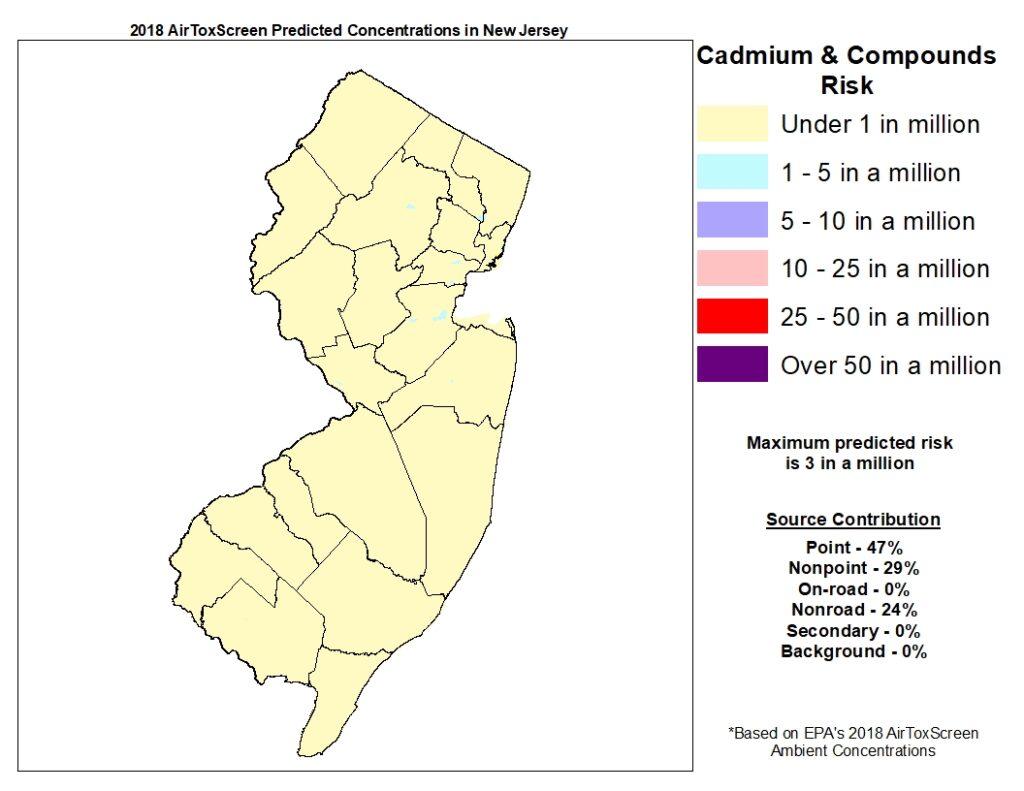
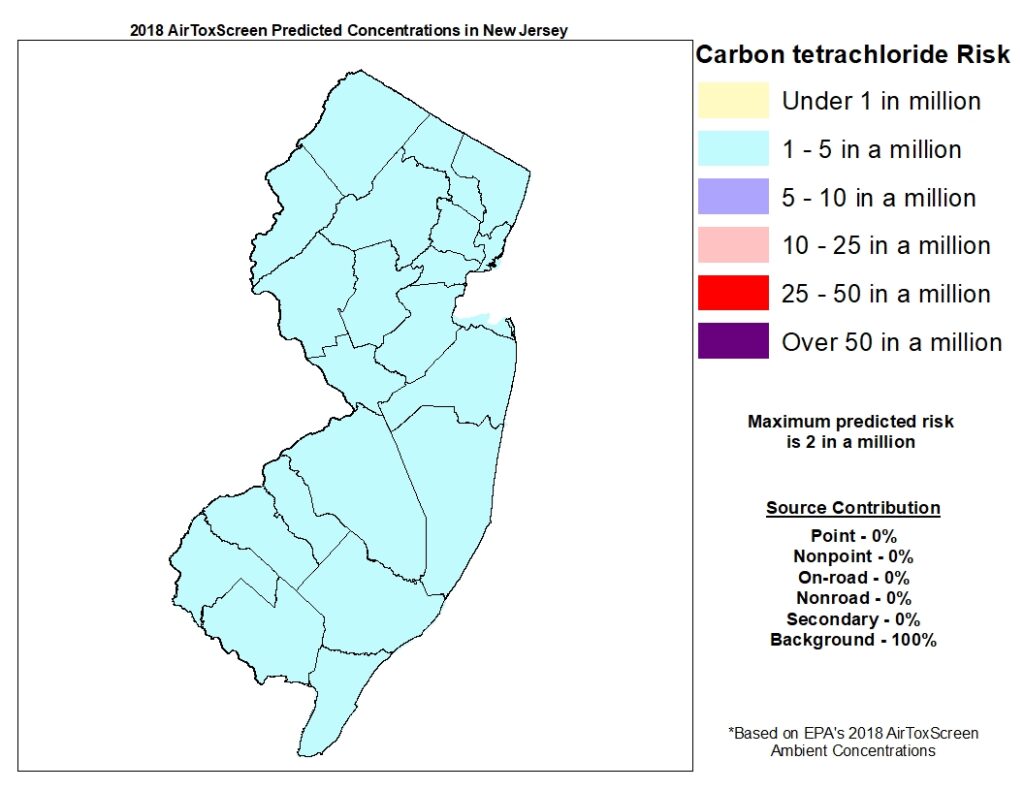
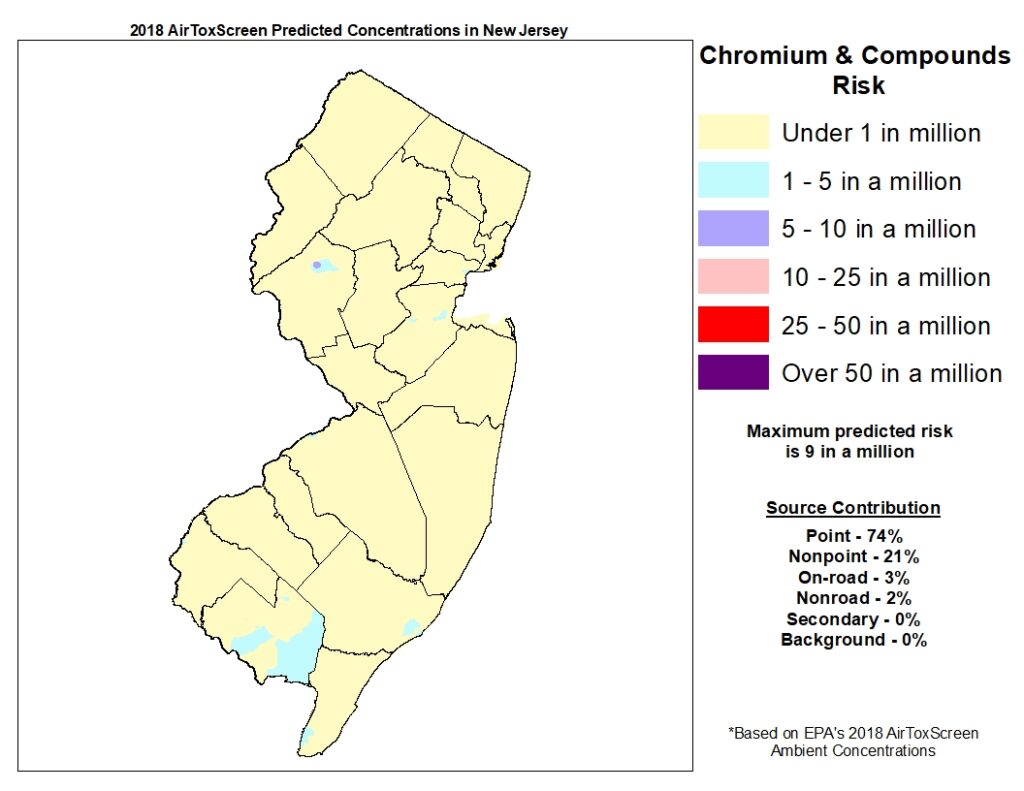
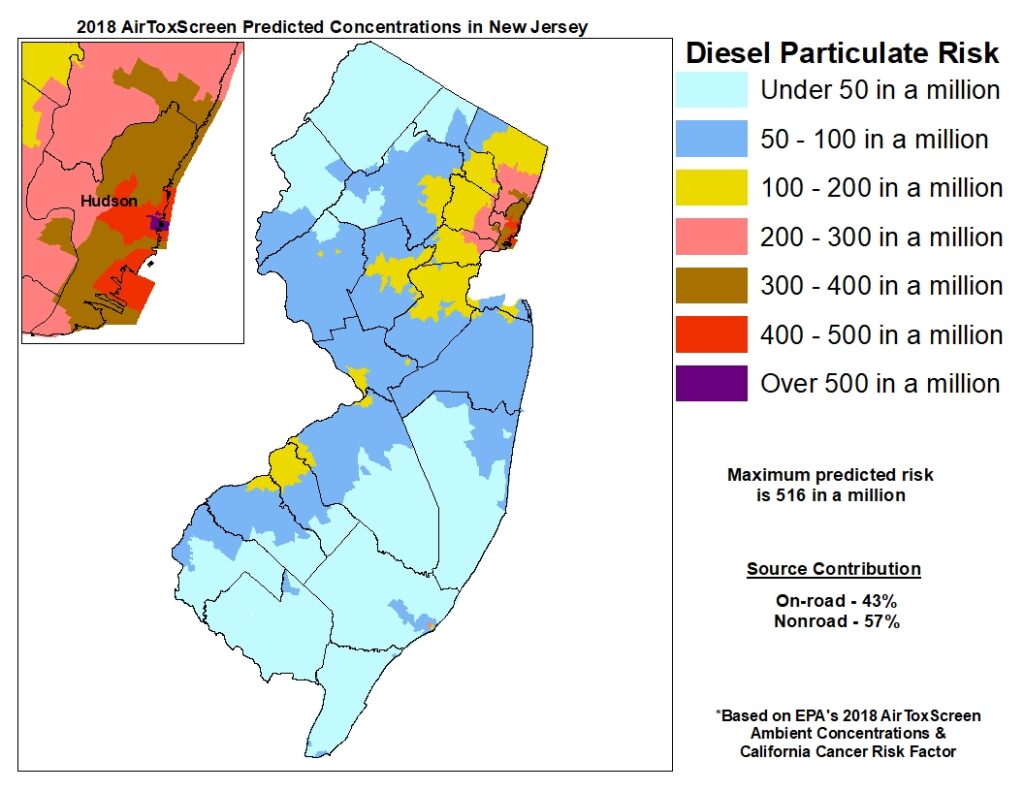
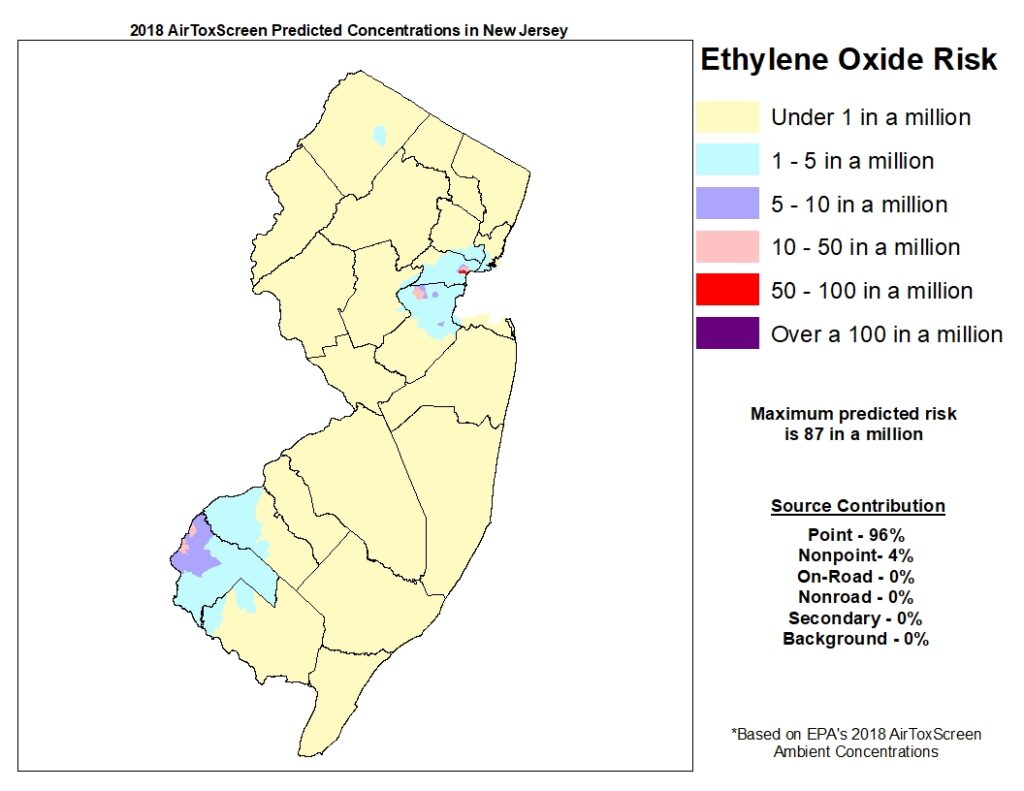
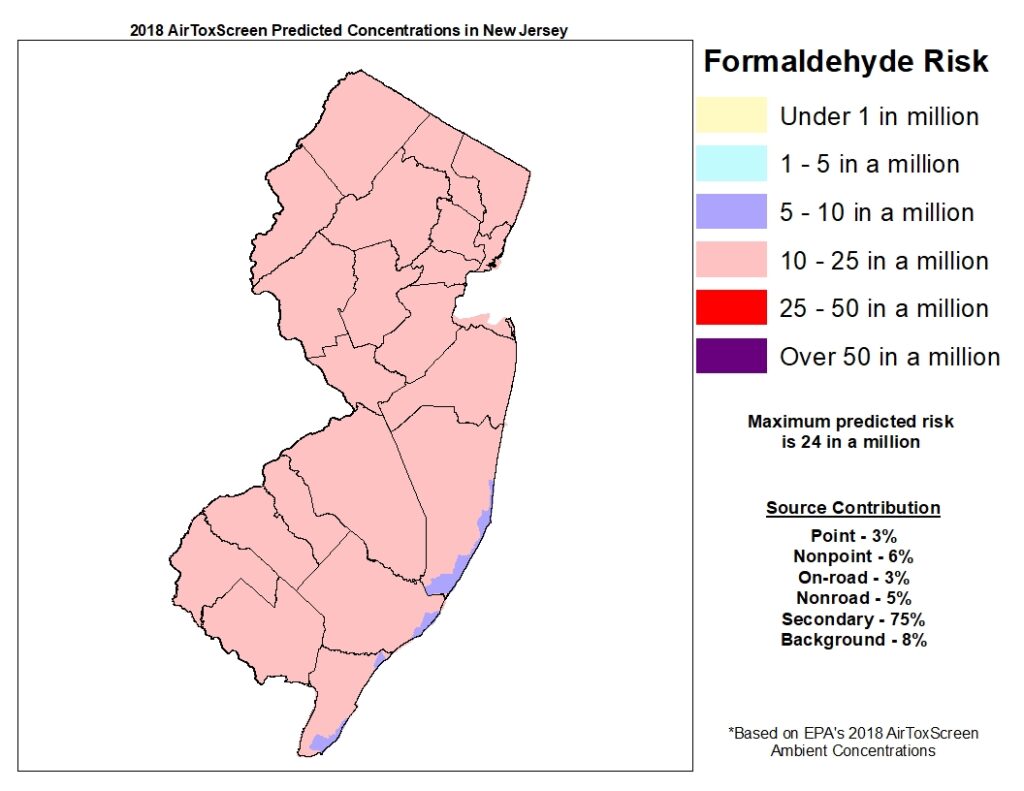
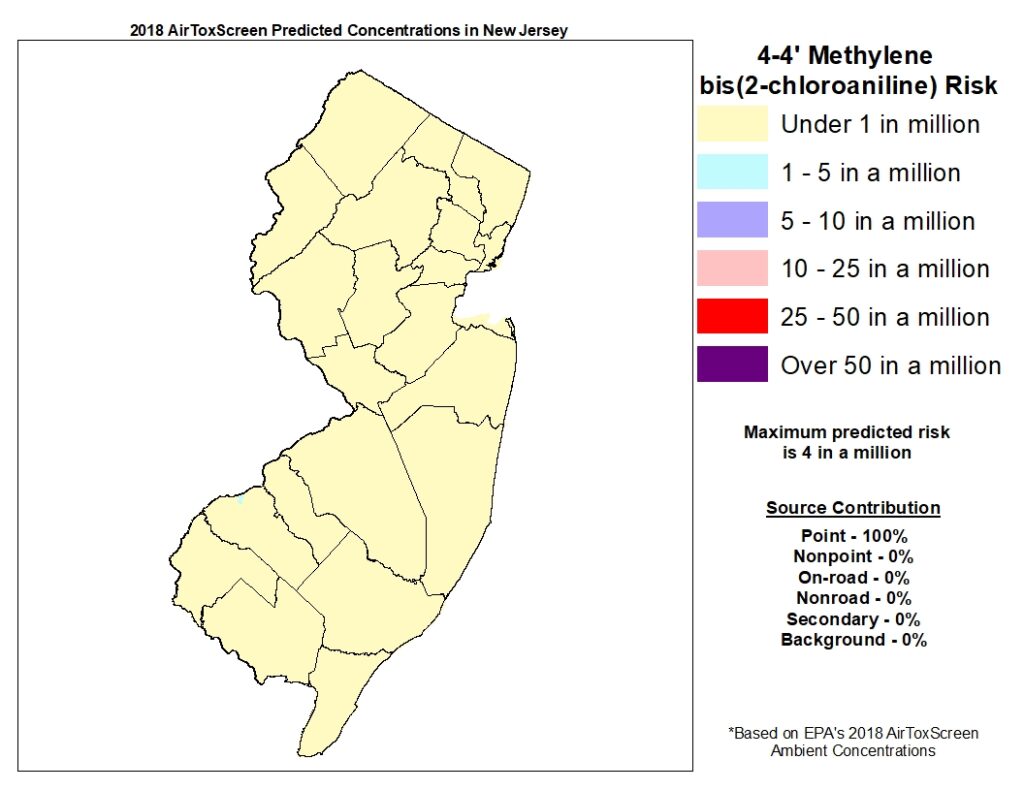
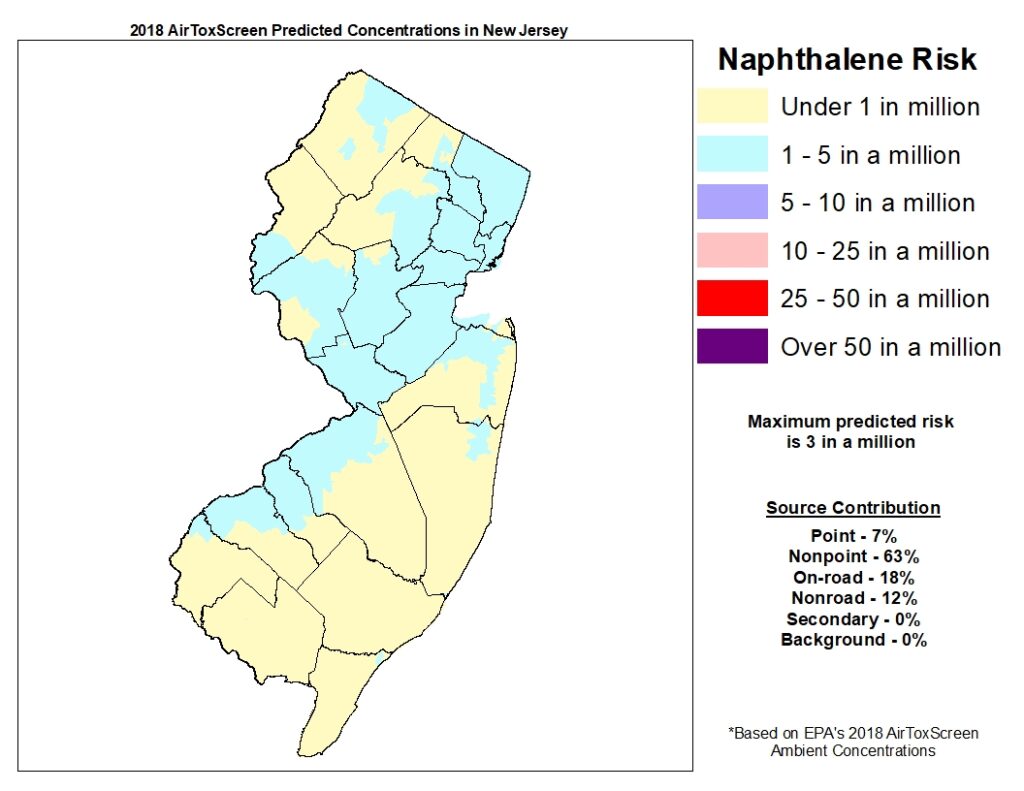
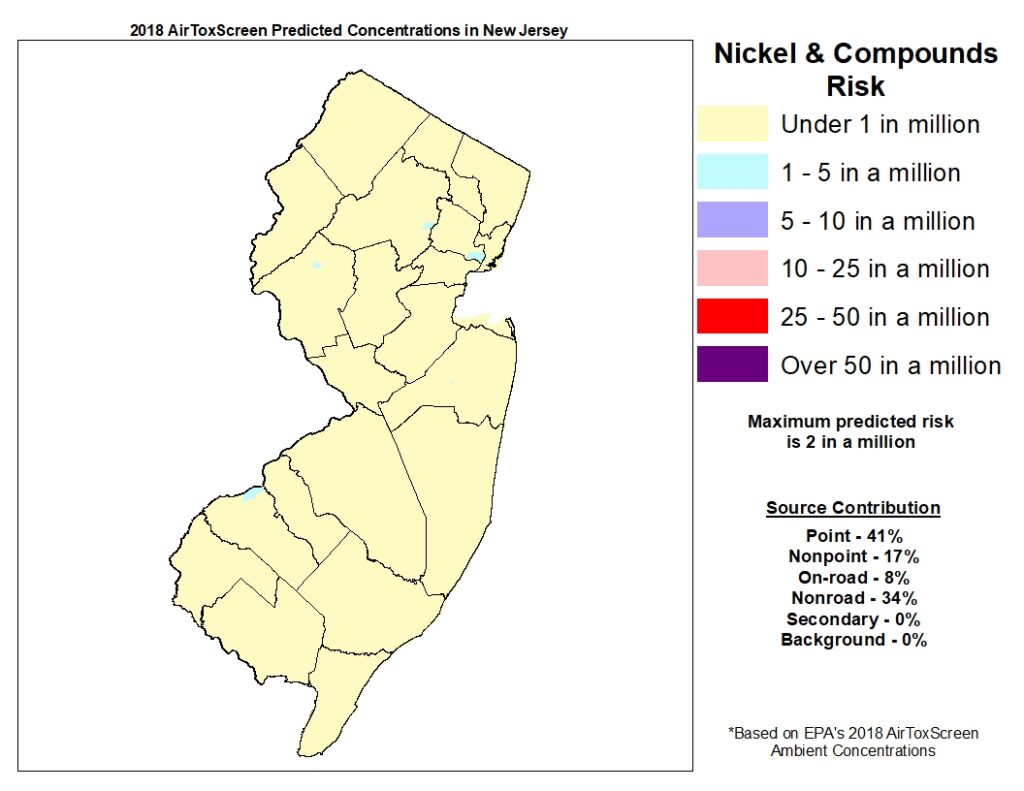
For more information on which areas are impacted by these chemicals of concern, see New Jersey’s chemical-specific risk maps tab on the left.
2018 Chemicals of Concern in New Jersey
| Pollutant | Number of Counties Above Health Benchmarks | Primary Source Category |
| Acetaldehyde | 21 | Secondary/Background |
| Arsenic | 1 | Mobile |
| Benzene | 21 | Mobile |
| 1,3-Butadiene | 6 | Mobile |
| Cadmium Compounds | 1 | Nonpoint |
| Carbon Tetrachloride | 21 | Background |
| Chromium VI | 4 | Point |
| Diesel Particulate Matter | 21 | Mobile |
| Ethylene Oxide | 8 | Point |
| Formaldehyde | 21 | Secondary/Background |
| Hydrazine | 1 | Point |
| 4-4’ Methylene bis(2-chloroaniline) | 1 | Point |
| Naphthalene | 16 | Nonpoint |
| Nickel Compounds | 1 | Point |
* For more information on which areas are impacted by the chemicals of concern, see the risk maps.
To see a state map showing the spatial variation in modeled air concentrations (at the census-tract level) for one of the fourteen chemicals of concern, click on the map:
COUNTY RISK RATIO TABLES
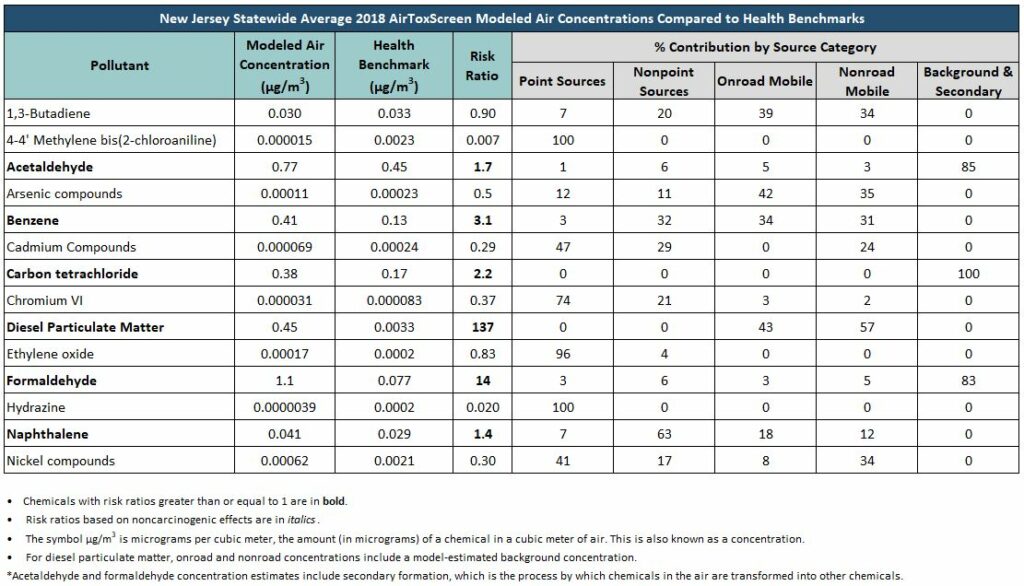
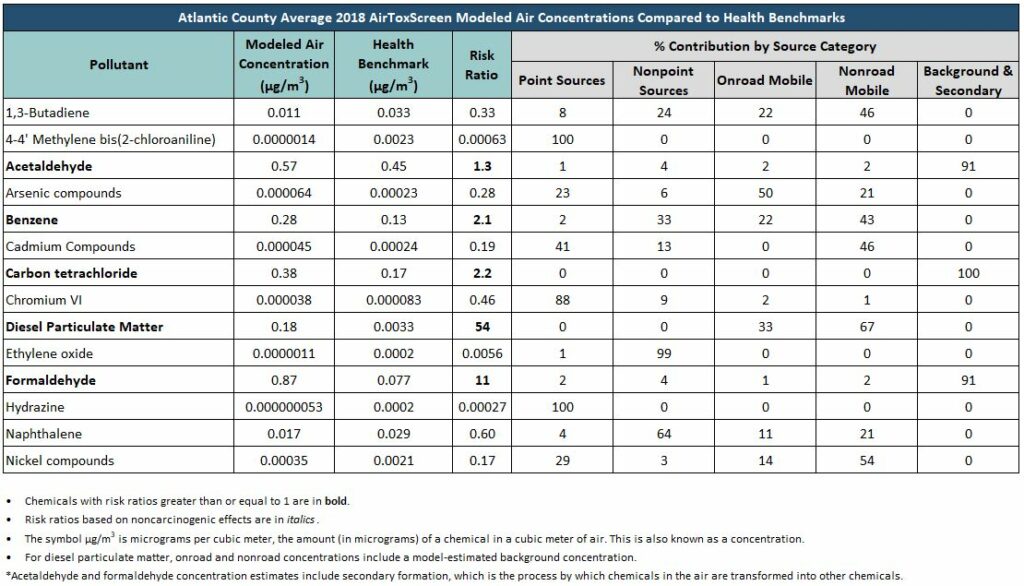
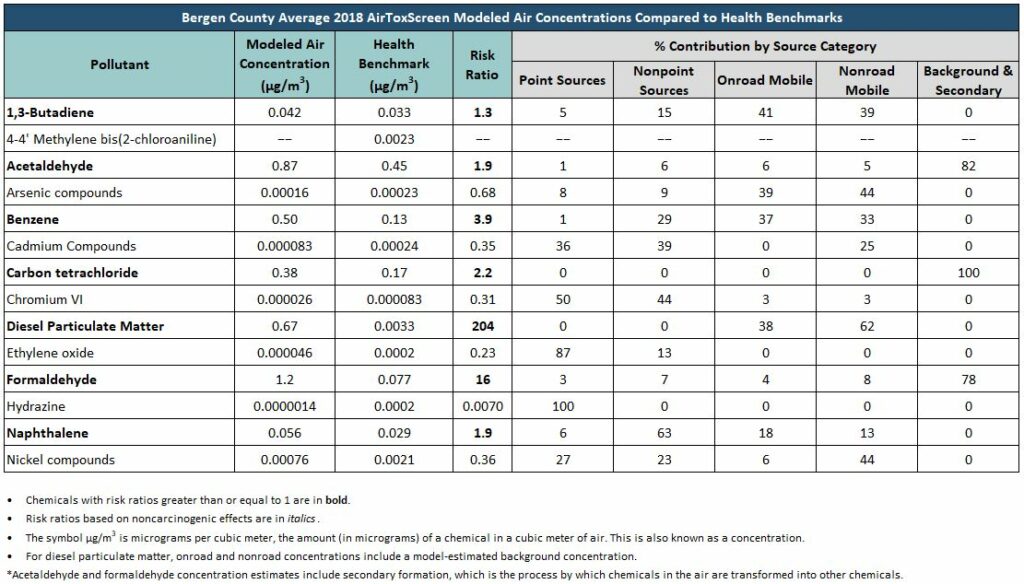
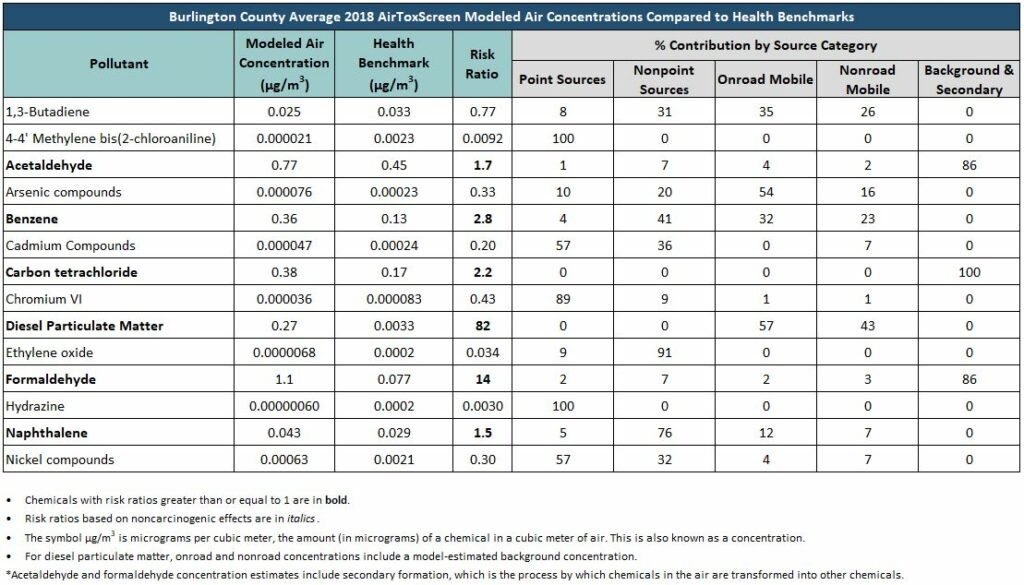
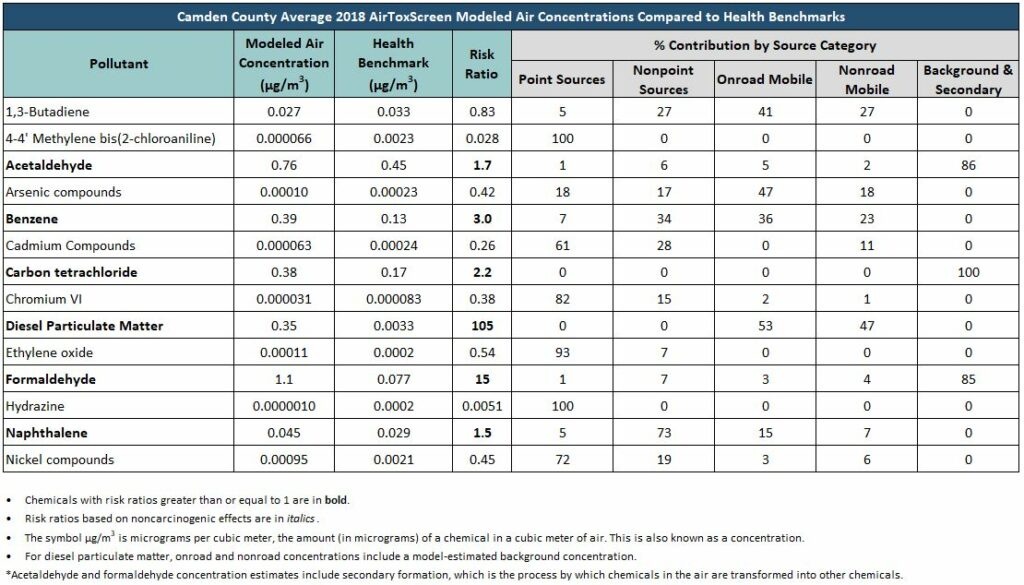
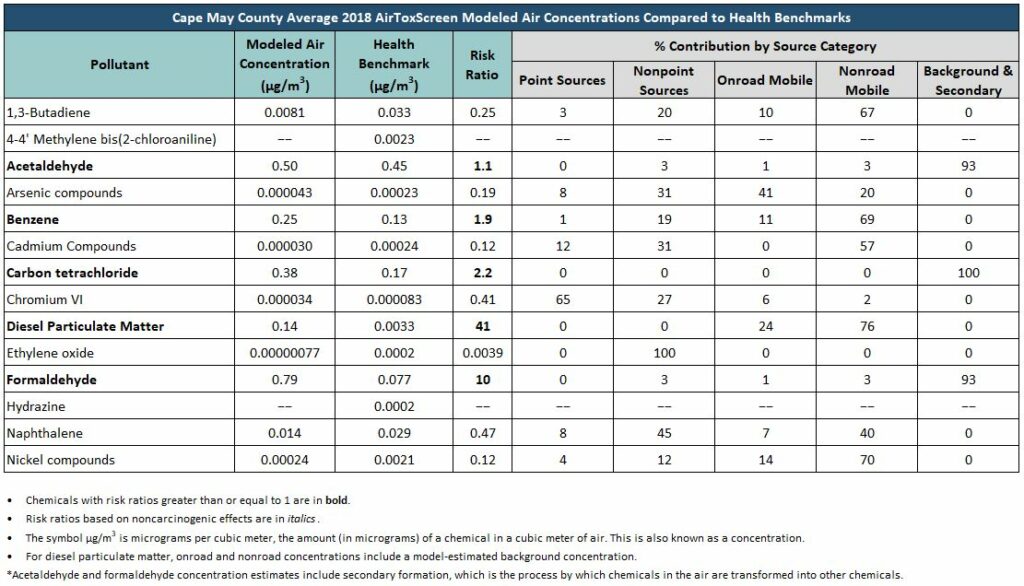
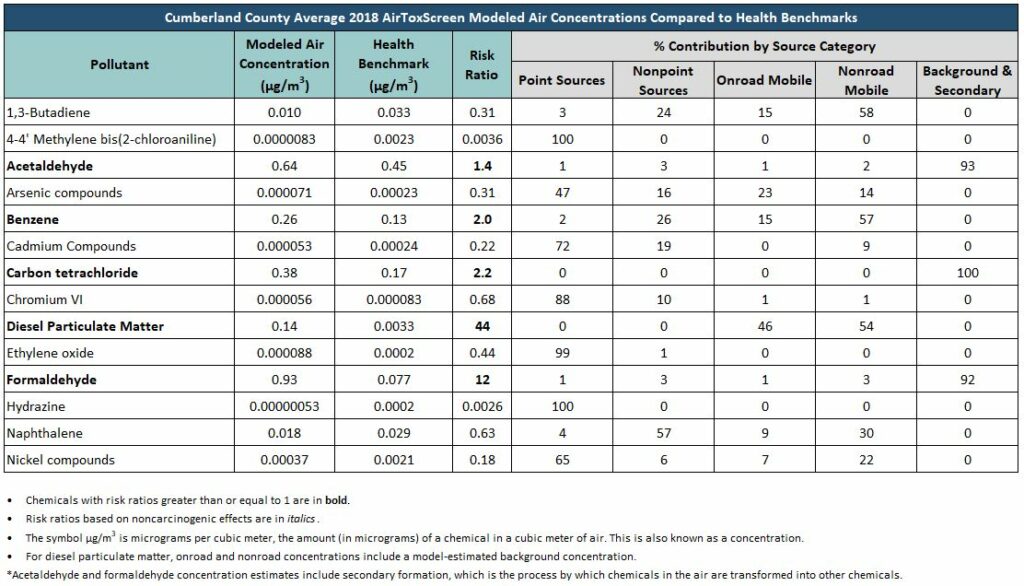
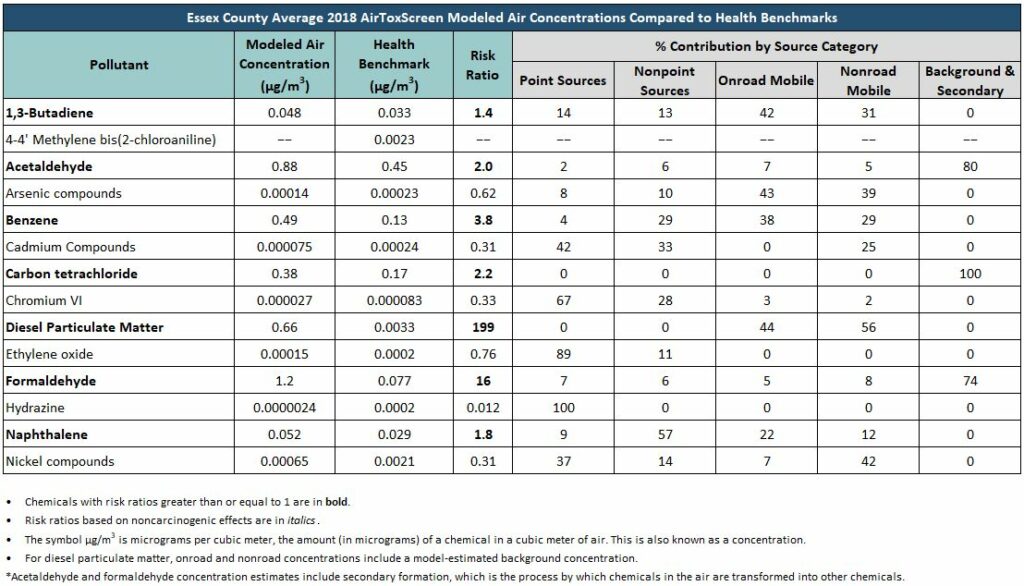
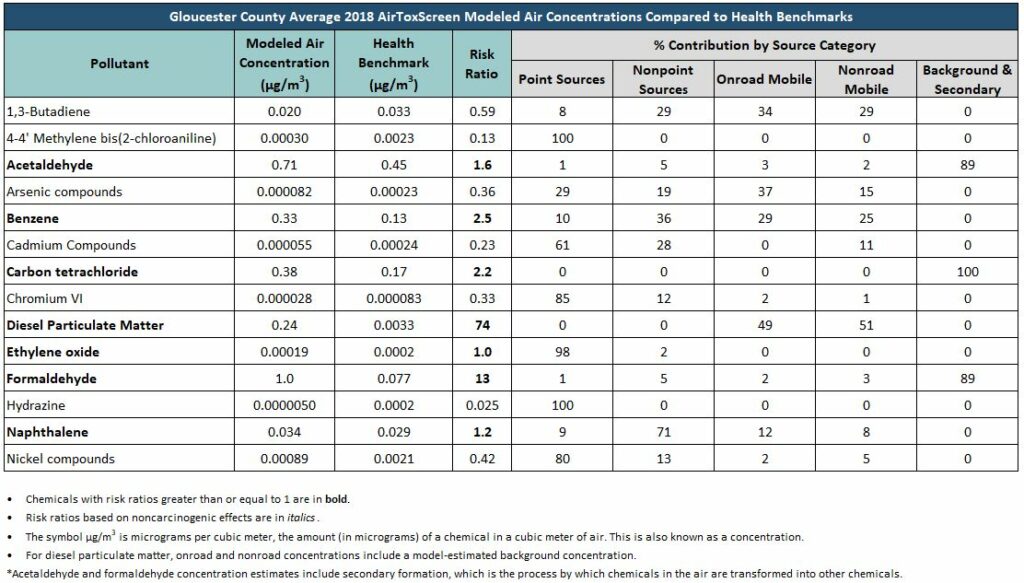
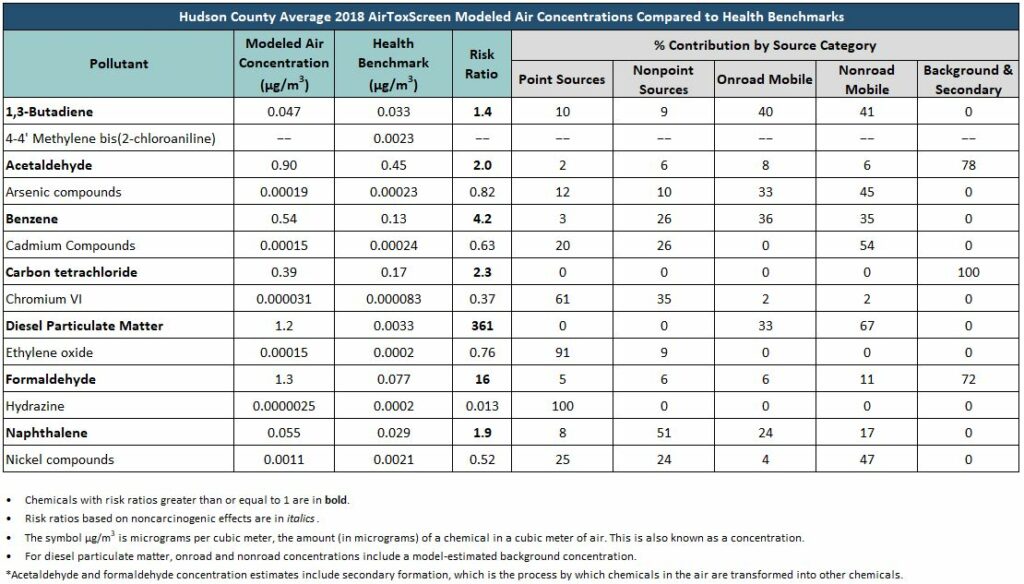
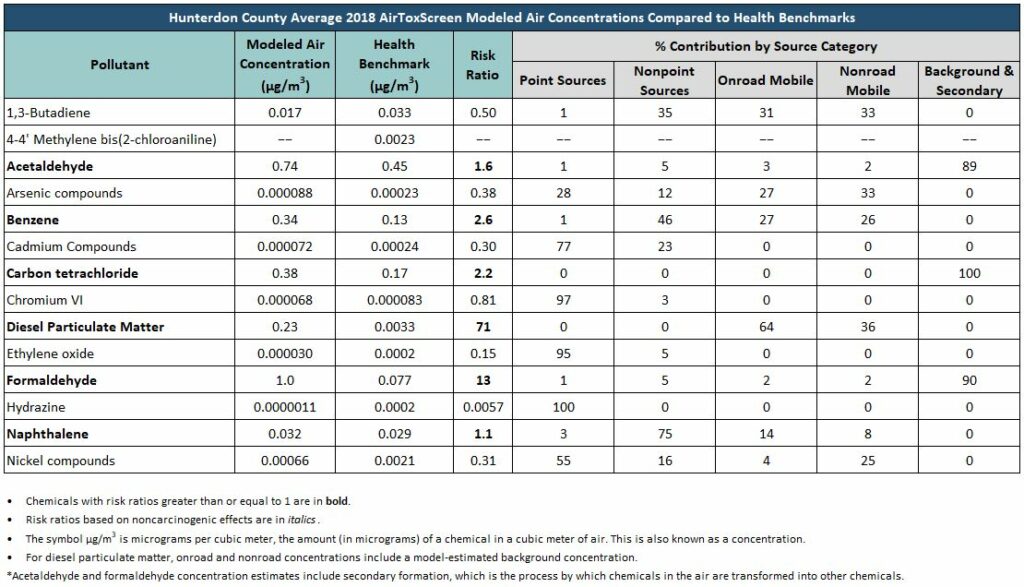
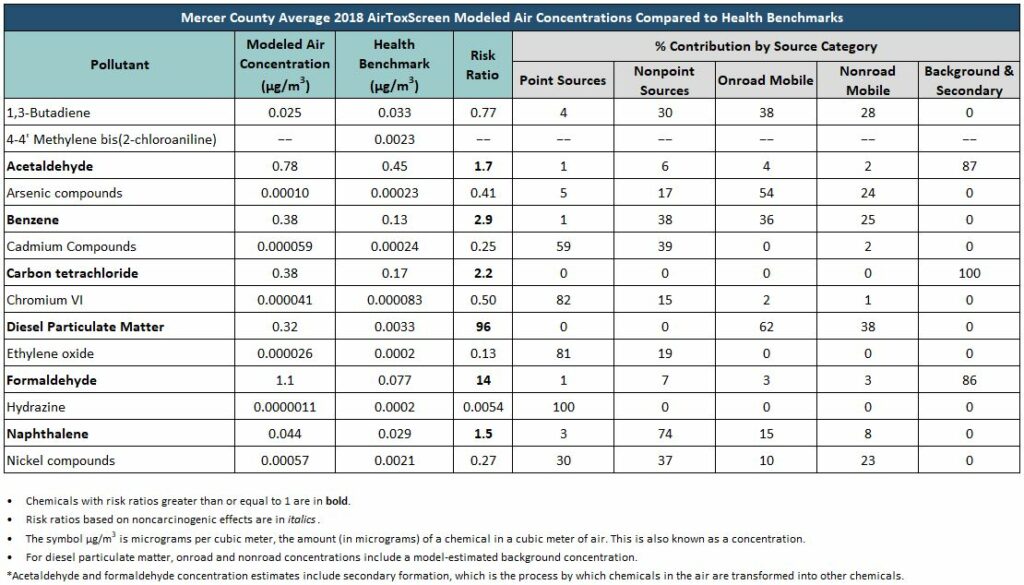
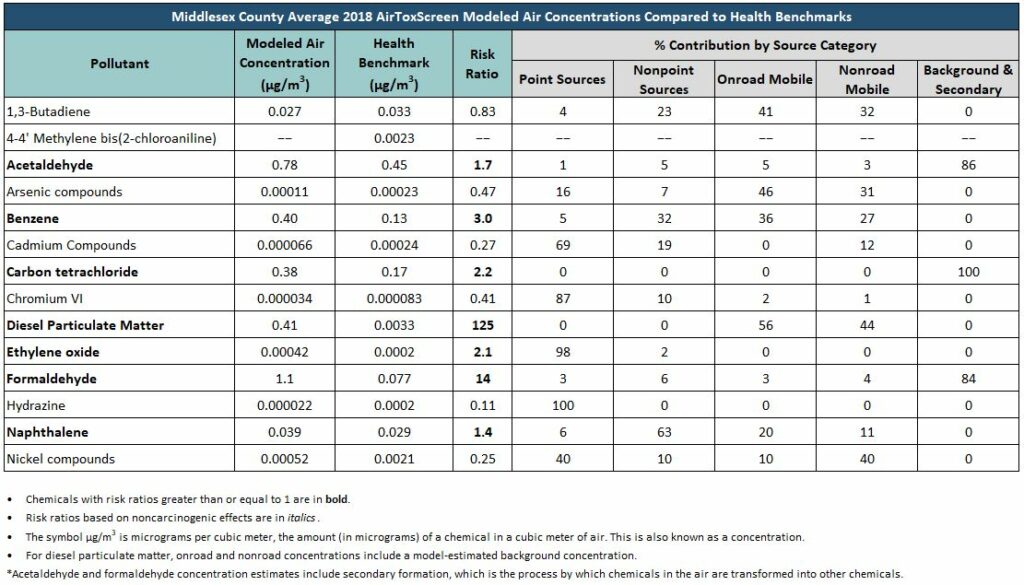
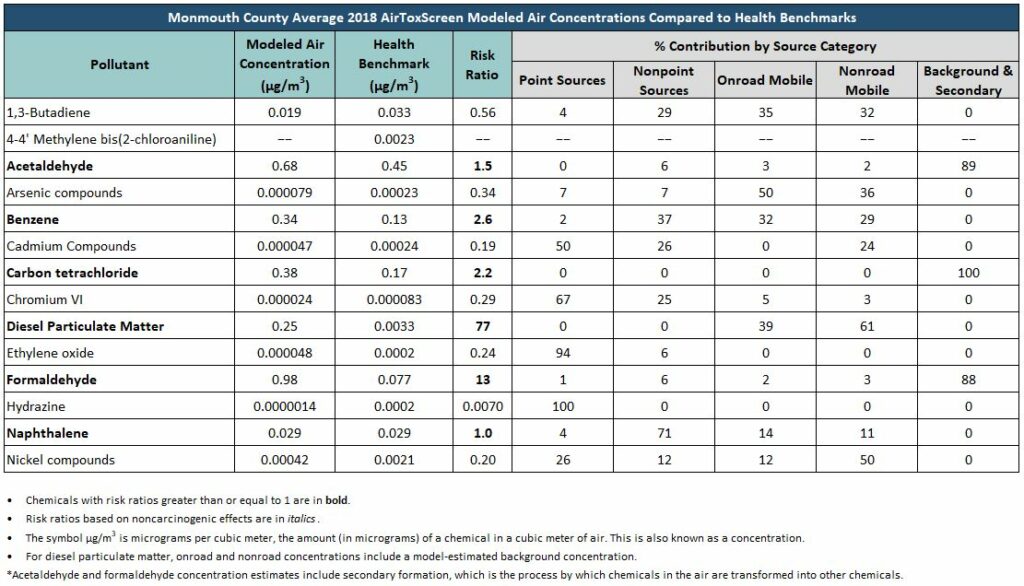
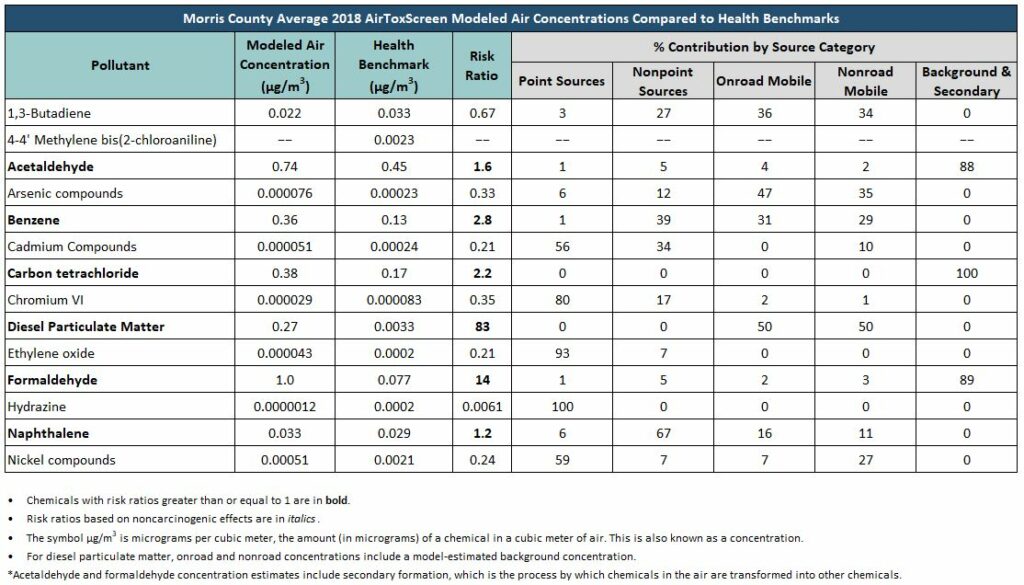
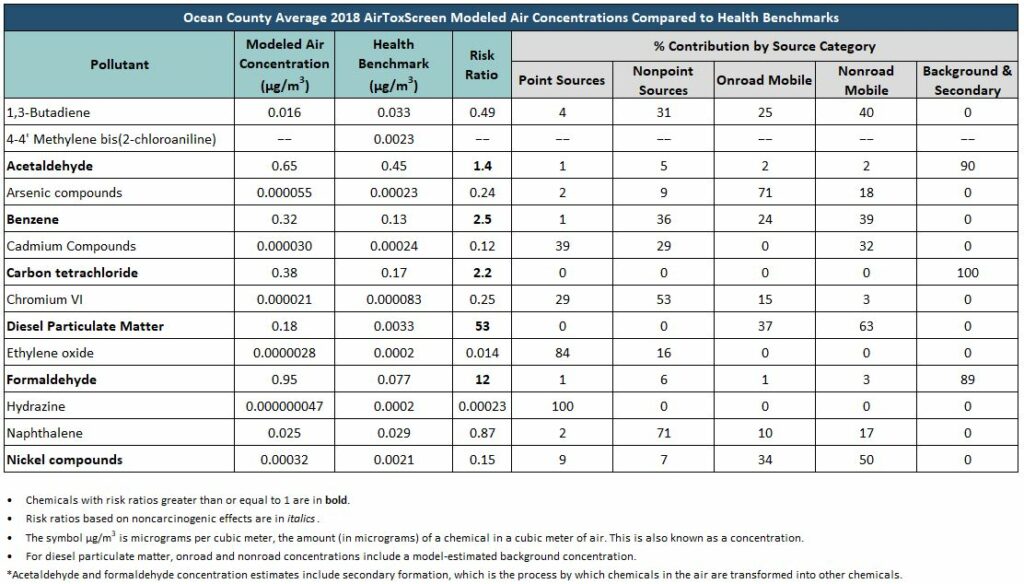
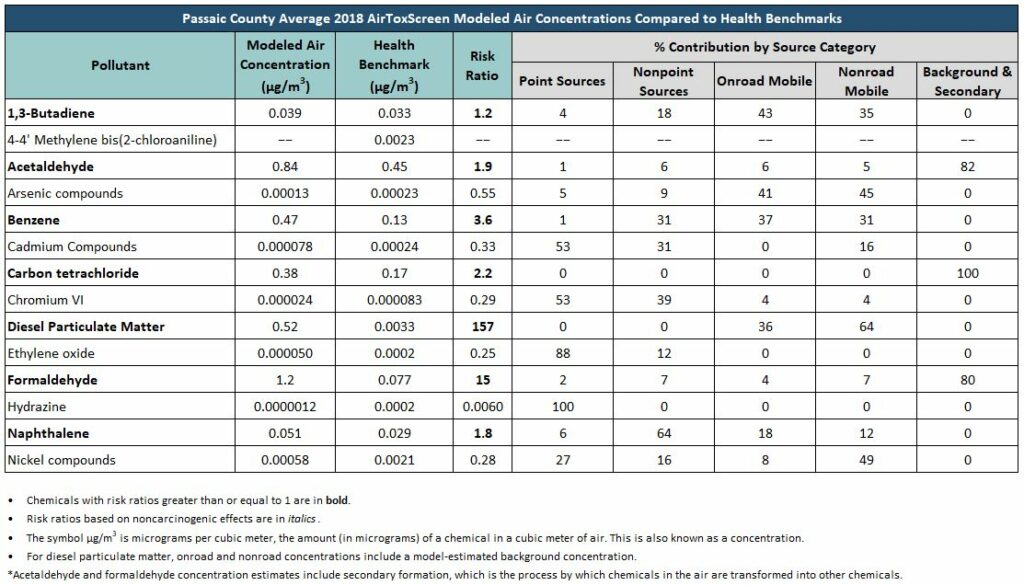
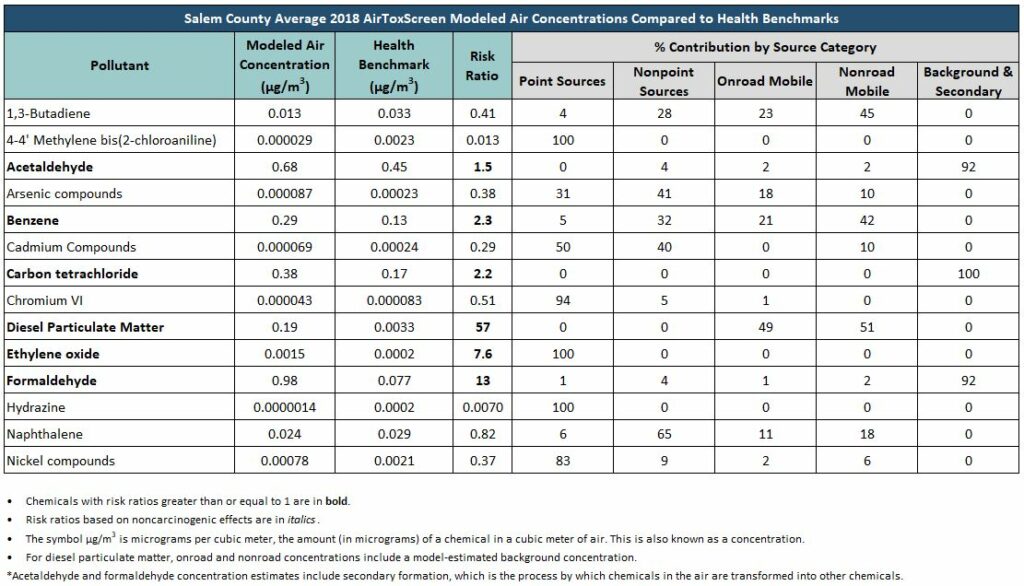
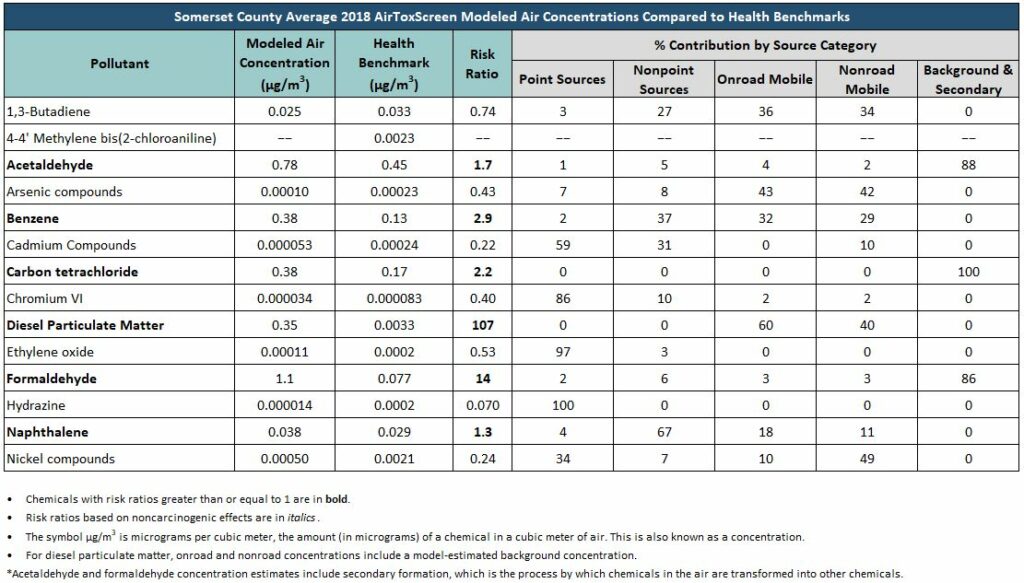
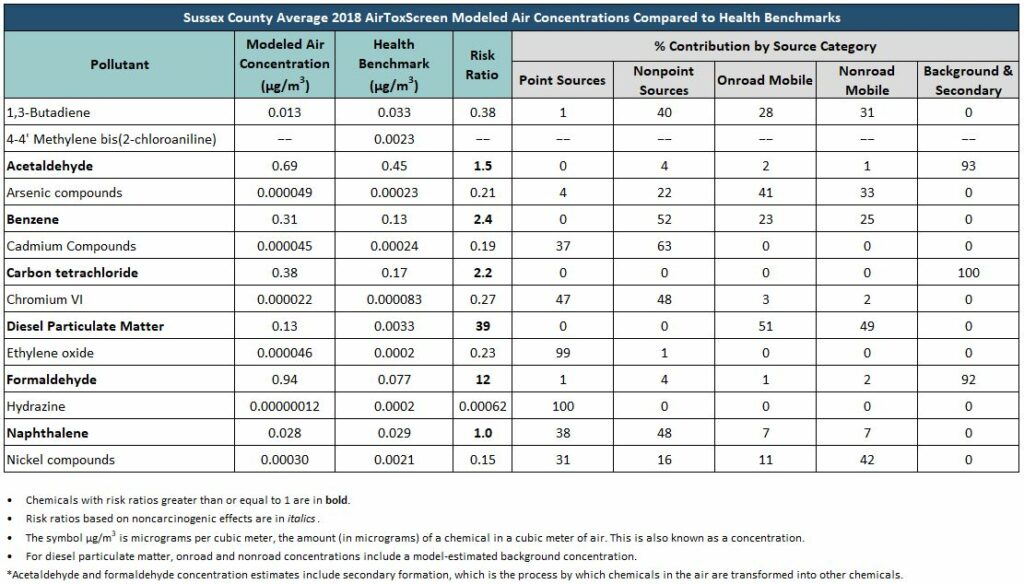
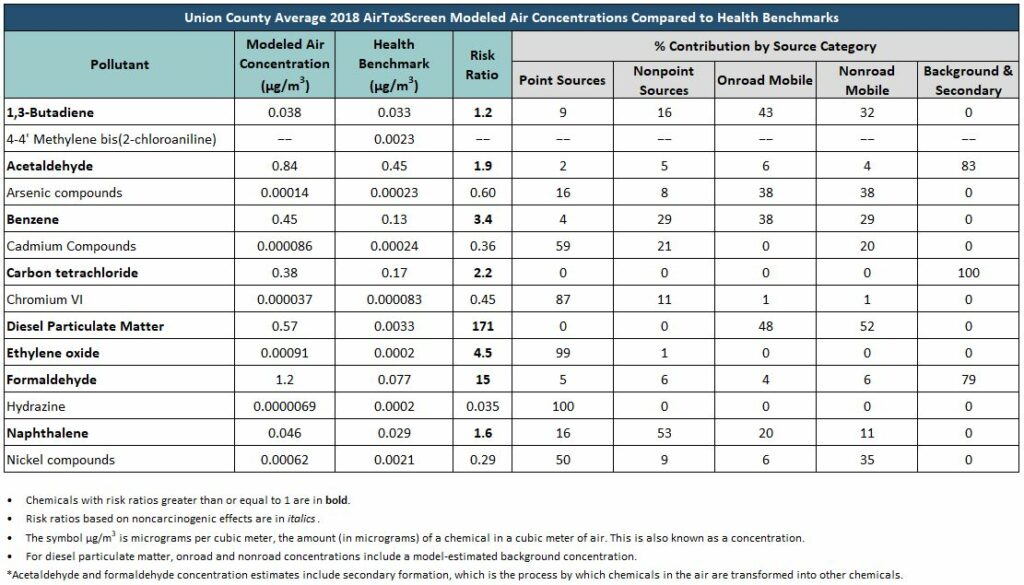
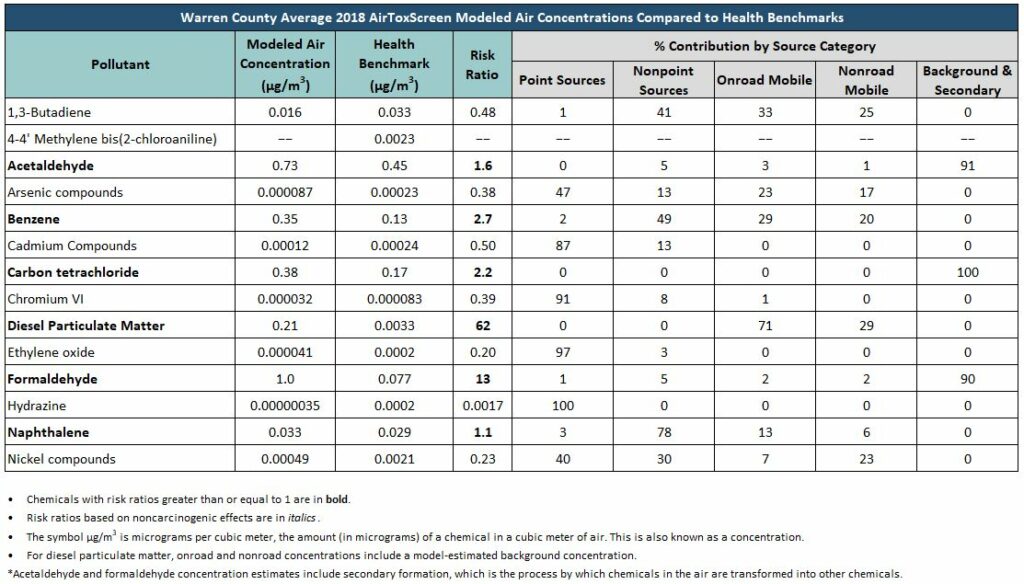
To see a statewide or county-specific table containing the 2018 AirToxScreen-based risk results (including ambient air concentrations, health benchmarks, risk ratios, and source category contributions) for each of the 14 air toxics of concern, click on statewide or the county charts below.
Previous Risk Results
EPA conducts an annual Air Toxics Screening Assessment known as AirToxScreen. From 1996-2014, this assessment was called the National-Scale Air Toxics Assessments (NATA) and was conducted every three years. In 1990, they conducted a “Cumulative Exposure Project” (CEP) which also included an assessment of air toxics. However, they emphasize that the methods used to conduct emissions inventories, modeling, and risk assessment vary somewhat from year to year, so the results are not exactly comparable.
New Jersey’s interpretation of past USEPA data is available below.
To determine whether the air toxics included in USEPA’s AirToxScreen, formerly known as the National-Scale Air Toxics Assessment (NATA) could be a potential human health problem in New Jersey, NJDEP compares the estimated NATA air concentrations to their chemical-specific health benchmarks. We divide the modeled air concentration by the health benchmark to get a number we call a risk ratio. If the risk ratio for a specific chemical is greater than one, it may be of concern. The risk ratio also shows just how much higher or lower the estimated air concentration is than the health benchmark. For more information, see How We Estimate Risk from Air Toxics.
New Jersey’s methods for estimating risk using the AirToxScreen (formerly NATA) results are somewhat different from USEPA’s methods, and therefore risk results presented here are different from the risk estimates found on the USEPA’s AirToxScreen website. New Jersey compares health benchmarks to the modeled ambient concentrations, while USEPA converts the ambient data into “exposure concentrations” using an exposure model that incorporates numerous assumptions about the demographics and activity patterns within a census tract. Resulting exposure concentrations may be higher or lower than ambient concentrations. Dispersion models have been tested over time by comparisons with ambient monitoring data, and have generally been shown to be comparable within a factor of two. However, for exposure modeling we feel that at this stage of development it adds a level of complexity and uncertainty that confuses rather than clarifies the true levels of exposure.
